View account analysis in checklists
If the Analysis page is enabled in a checklist document, you can view various analyses of your client's accounts to help keep track of the steps required for your work program.
For more information on how to enable the Analysis page in a checklist, see Review and modify the checklist default settings.
Use the Analysis page for analytical review
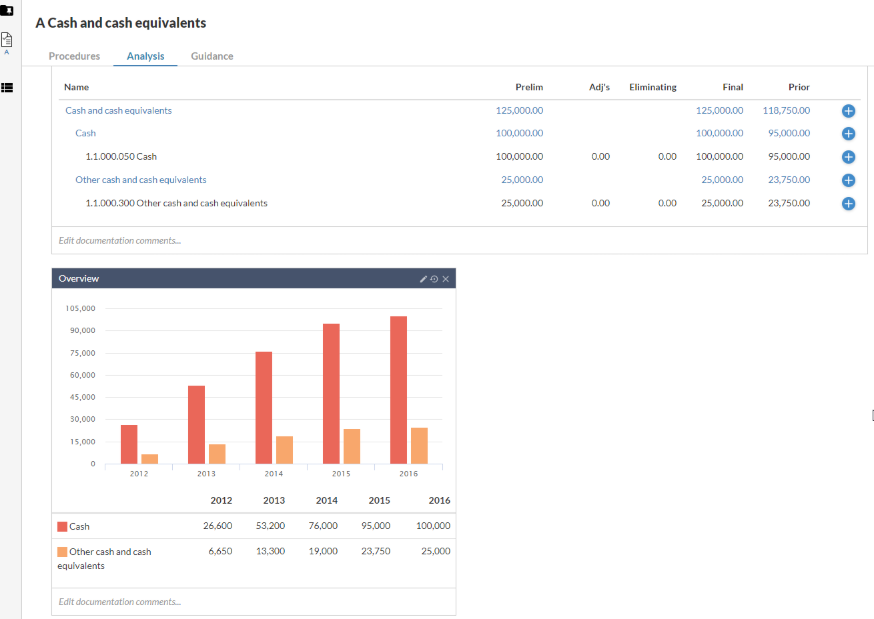
Select the Analysis tab in the checklist document. You can find information that's relevant to the procedures in the checklist. Tables display groups and accounts from the trial balance, while charts represent financial data graphically.
You can use the information in the Analysis page to complete checklists and work programs.
-
The most relevant financial information is displayed on the same page as its checklist, so you don't need to have the trial balance open in a separate tab or page.
-
The information is displayed graphically, to help you perform high-level analyses and to identify areas of the trial balance that you may need to investigate.
-
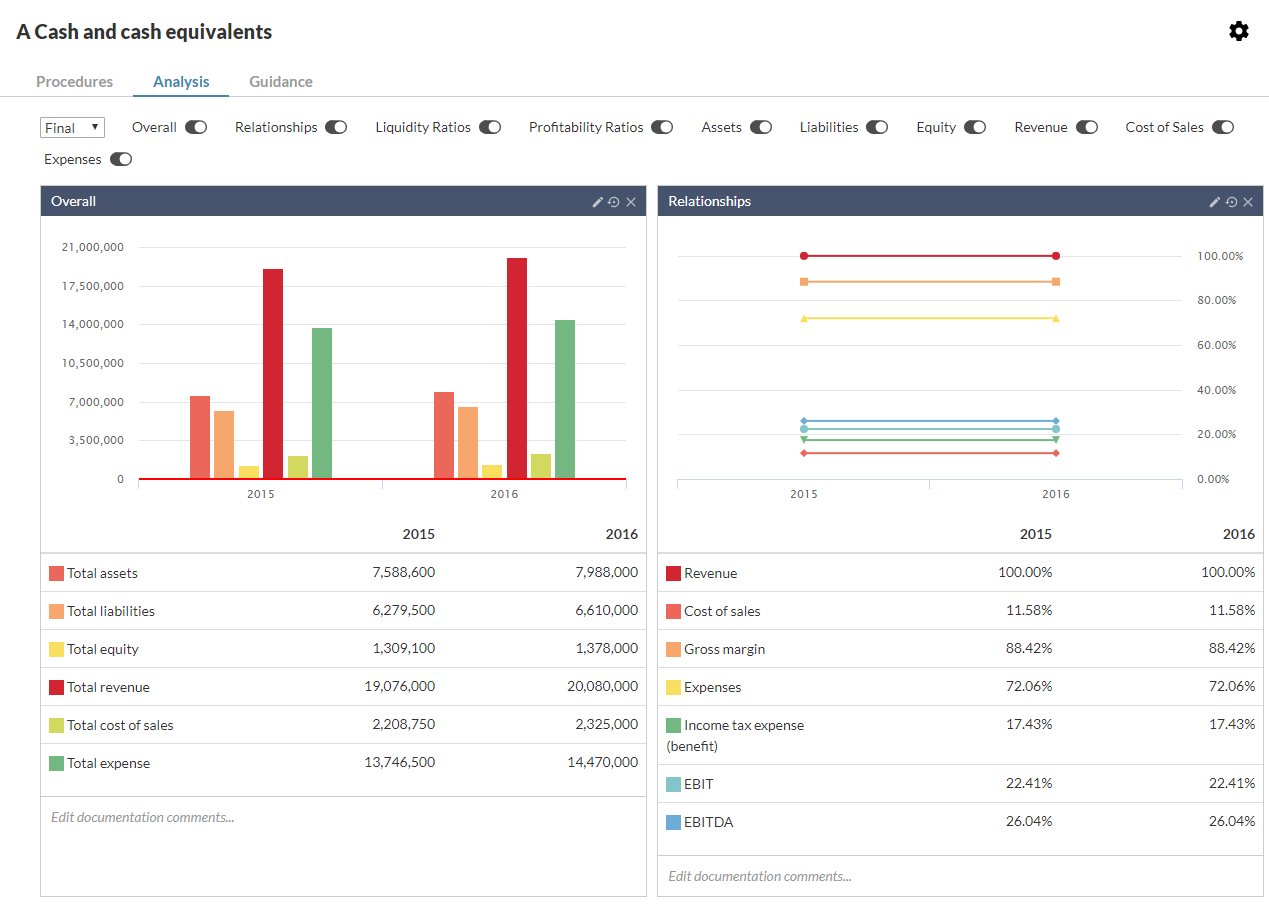
You can hide or display specific tables and charts by selecting the toggles (
 ) at the top of the Analysis section.
 -
You can use the dropdown at the top of the section to switch the display between Preliminary balances and Final balances.
-
Each table and chart has a section where you can enter comments or other information.
Select analyses to display
You can select the specific analyses that you want to view in the Analysis page.
To select the analyses to display:
-
Select the Toggle edit view icon (
 ), then select the Settings icon (
 ) .
) .The Checklist Settings dialog displays.
Note: You can only access the default checklist settings screen for a checklist that you've added to the engagement, not the checklists that are part of the default content that comes with your product.
-
From the Analysis dropdown, select the desired analysis type to display. Select Save.
-
Use the toggles (
) to select which charts and tables to display.
Modify the information displayed in charts
You can make some simple changes to modify the information the charts display.
Note: This change only affects the information that the chart displays (the chart view). It is not reflected in other files or the downloaded reference copies.
To modify the information displayed in charts:
Select the Edit icon (![]() ) in the chart's title bar, then select the Delete icon (
) in the chart's title bar, then select the Delete icon (![]() ) to remove an item from the chart.
) to remove an item from the chart.
Select the Edit icon (![]() ) in the chart's title bar, then select the Add icon (
) in the chart's title bar, then select the Add icon (![]() ) to add an item to the chart. Select an item from the displayed list to add it to the chart.
) to add an item to the chart. Select an item from the displayed list to add it to the chart.
Select Edit documentation comments… to display a text box where you can add comments.
Select the Reset to default icon (![]() ) to reset the chart to its original state.
) to reset the chart to its original state.
Hover the pointer over an item in the chart to display a pop-up with the associated value.
Modify the information displayed in tables
You can remove rows, add annotations and add documentation comments to analysis tables.
To modify the information displayed in tables:
Select the Settings icon (![]() ) to display the settings for the table, then select the desired items to display.
) to display the settings for the table, then select the desired items to display.
Select Edit documentation comments… to display a text box that you can use to add comments.
Select the Reset to default icon (![]() ) to reset the table to its original state.
) to reset the table to its original state.
Select the Add annotation icon (![]() ) to add an annotation to accounts or financial groups.
) to add an annotation to accounts or financial groups.
Add custom groups, cycles or areas to the analysis tables
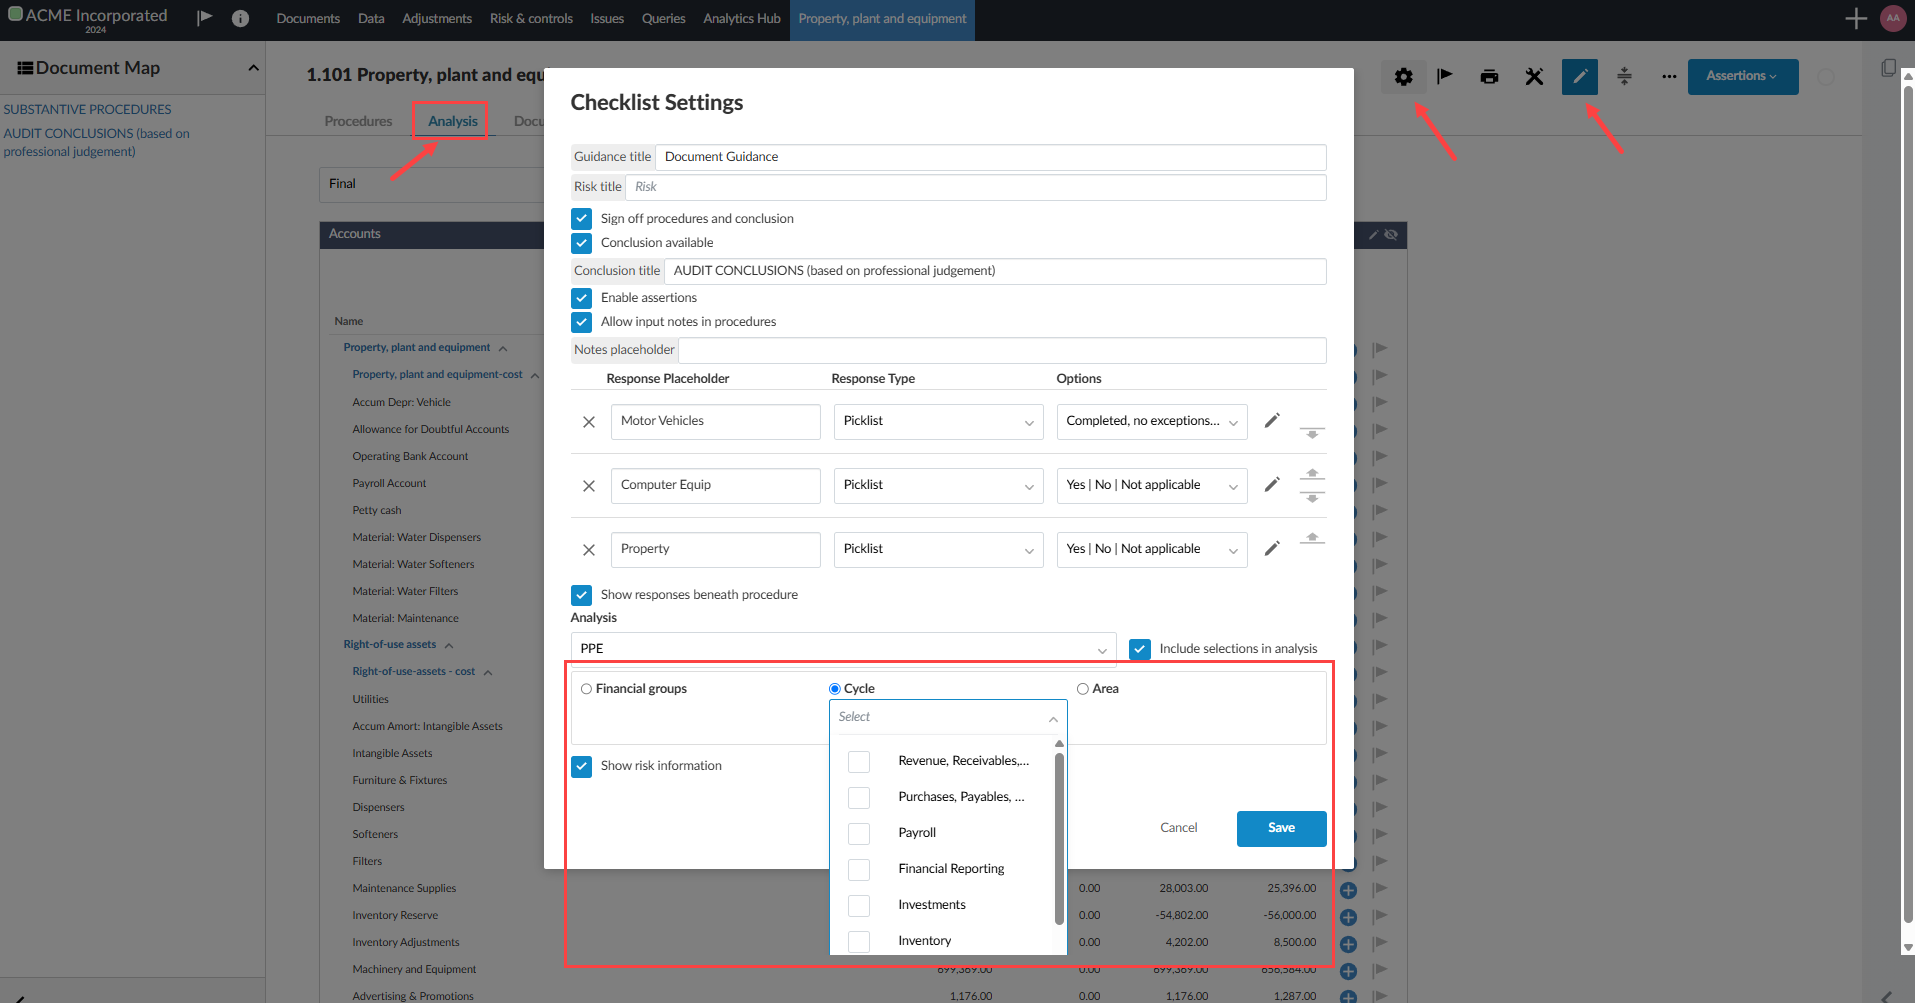
You can include custom financial groups, areas and cycles for analysis within Documents checklists that feature an Analysis tab. You can modify the checklist settings to include custom financial groups, areas and cycles using the radio button for selection. You can further specify the selection by selecting the dropdown under that category.
Note: this option is not available for either Analysis Documents or for Analysis Charts embedded into the financial statements.
To learn more about analysis in checklists, refer to View account analysis in checklists
Note: The Analysis tab must be enabled in a checklist document to use this feature. The Analysis tab allows you to view various analysis of your client's accounts to help keep track of the steps required for your work program.
For more information on how to enable the Analysistab in a checklist, see Review and modify the checklist default settings.
Add custom groups, cycles or areas to the analysis tables
-
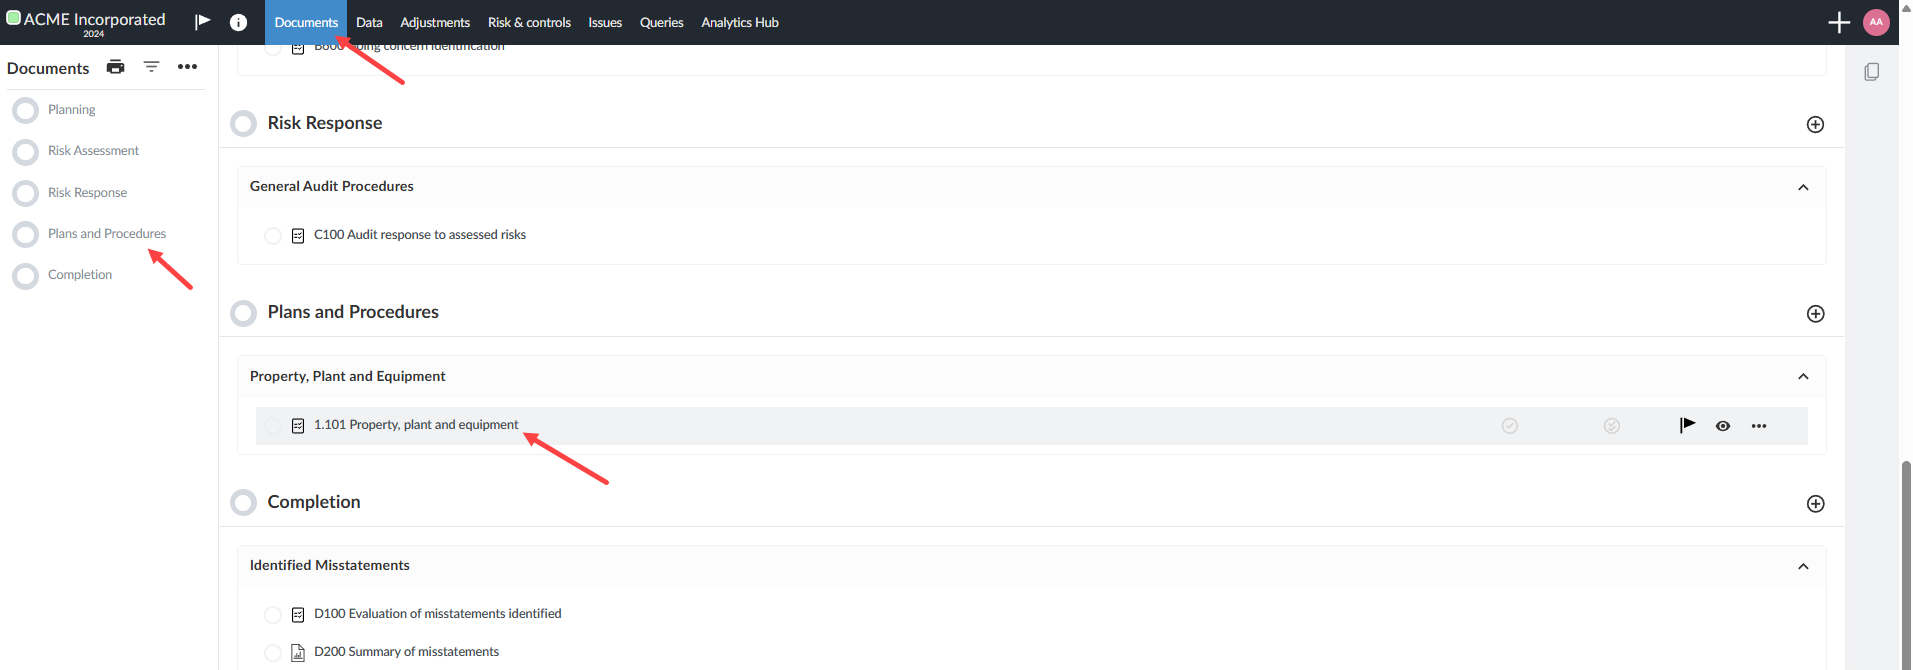
Open the Documents page or your engagement.
-
Click a document that has analysis enabled. In the example below, the document Property, plant and equipment is selected under the Plans and Procedures section of the Documents page.
-
Click the Analysis tab, in the document checklist.
-
Click the edit icon [
 ].
]. -
Click the settings icon [
 ].
]. -
Click the checkbox Include selections in analysis.
-
Click the radio button beside the category you wish to include for analysis: Financial groups, Cycle or Area.
-
Select the dropdown menu under Financial groups, Cycle or Area to see a list of your custom groups.
-
Select the groups to be included in analysis.
-
Click Save.