Información financiera
Esta visualización híbrida de Sherlock Canada proporciona información para un encargo más eficaz, entre otras cosas:
Cada pestaña incluye controles para mostrar los datos en función del nombre del cliente y del cierre del ejercicio.
Nota: Antes de utilizar las visualizaciones de Sherlock por primera vez, debe configurarlas mediante las opciones de la pestaña Configuración . Algunos ejemplos de estas opciones son:
- Activo circulante: Especifique las hojas de clientes potenciales que se clasifican como activos corrientes. Estas hojas de ruta se utilizarán para calcular diferentes ratios financieros y generar gráficos en Sherlock con fines de evaluación comparativa. Tenga en cuenta que las hojas de trabajo de la lista de hojas de trabajo por defecto de Working Papers se seleccionan por defecto, pero pueden eliminarse si no son aplicables.
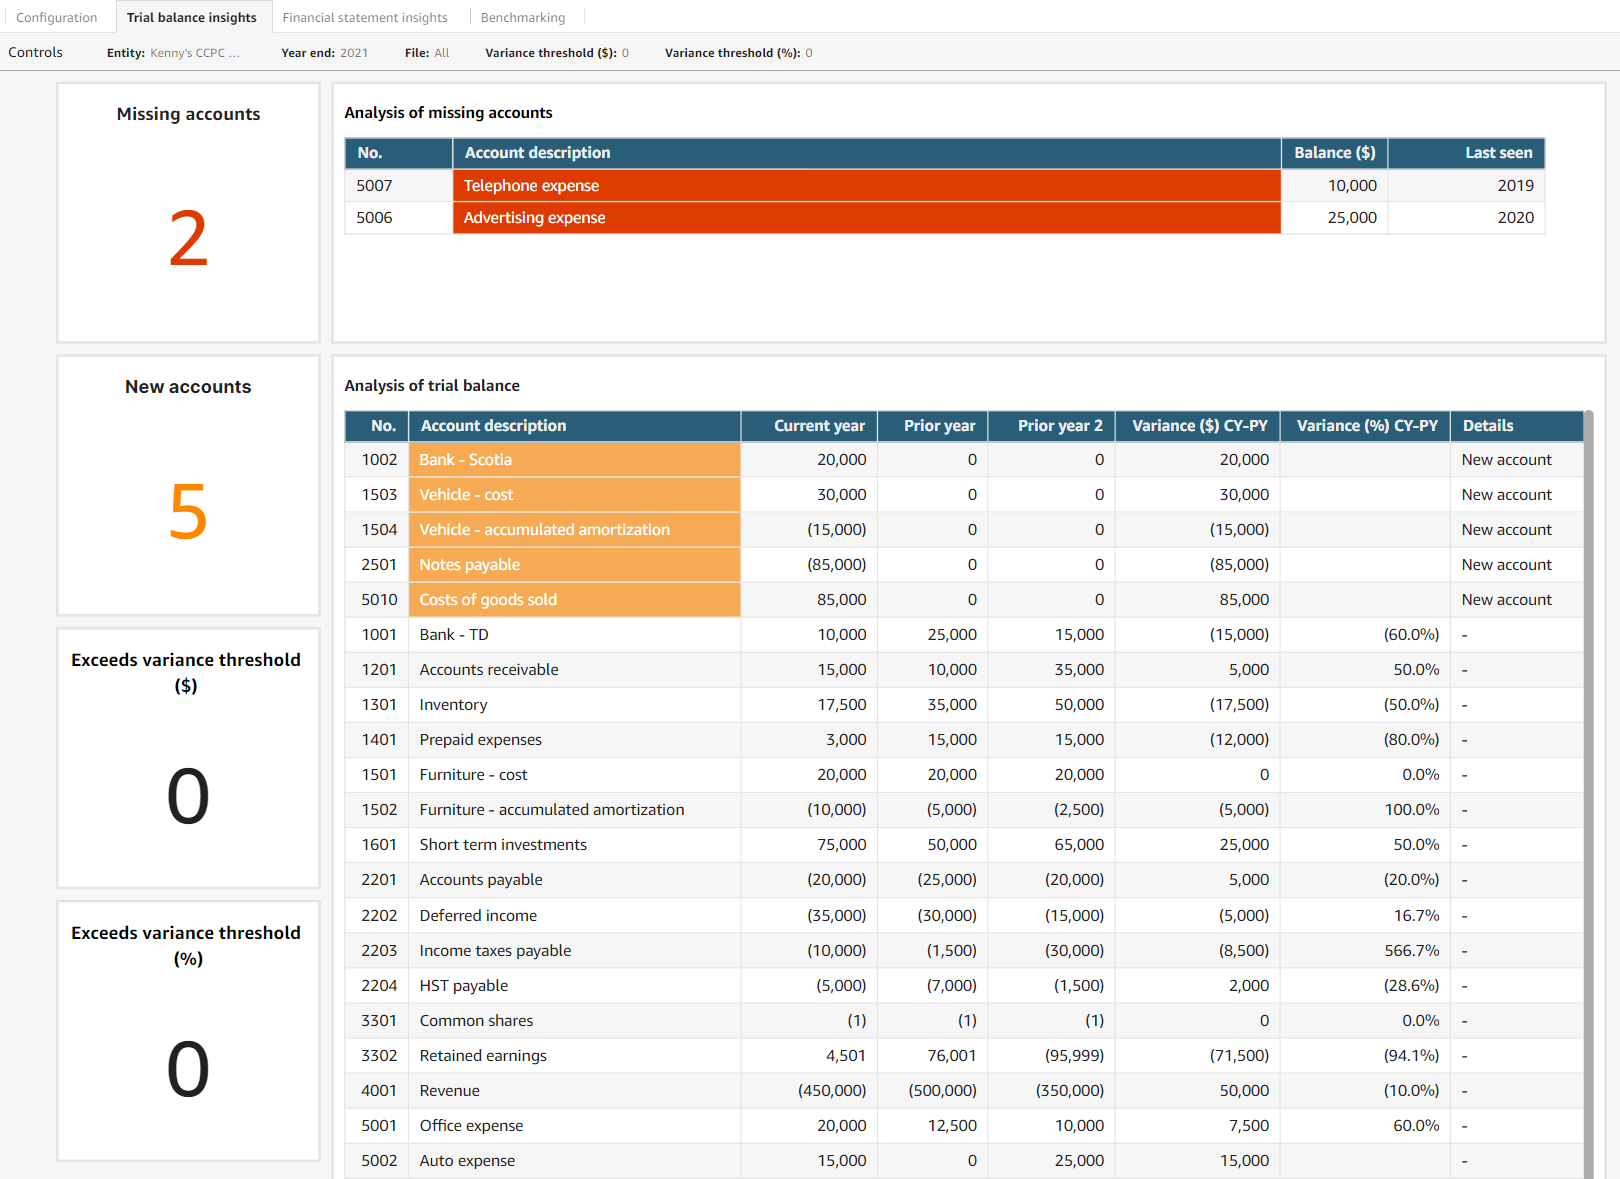
Opciones de balance de comprobación
| Widget | Descripción |
|---|---|
| Cuentas pendientes | Muestra el número de cuentas que no están incluidas en el balance de comprobación del año en curso, pero que estaban presentes en años anteriores. |
| Análisis de las cuentas pendientes | Muestra los detalles de las cuentas que faltan para el año seleccionado. |
| Nuevas cuentas | Muestra el número de cuentas nuevas en el encargo para el año seleccionado. |
| Análisis del balance de sumas y saldos | Muestra detalles del balance de sumas y saldos importado para el año seleccionado. |
| Supera el umbral de variación ($) | Muestra el número de cuentas con una desviación superior al importe del control Umbral de desviación ($) , en comparación con el año anterior. Este widget puede utilizarse junto con el widget Supera el umbral de desviación (%) , pero sólo resaltará las filas del Análisis del balance de comprobación que cumplan uno de los dos umbrales, no ambos. |
| Supera el umbral de varianza (%) | Muestra el número de cuentas con una desviación superior al importe del control Umbral de desviación (%) , en comparación con el año anterior. Este widget puede utilizarse junto con el widget Supera el umbral de desviación ($) , pero sólo resaltará las filas del Análisis del balance de comprobación que cumplan uno de los dos umbrales, no ambos. |
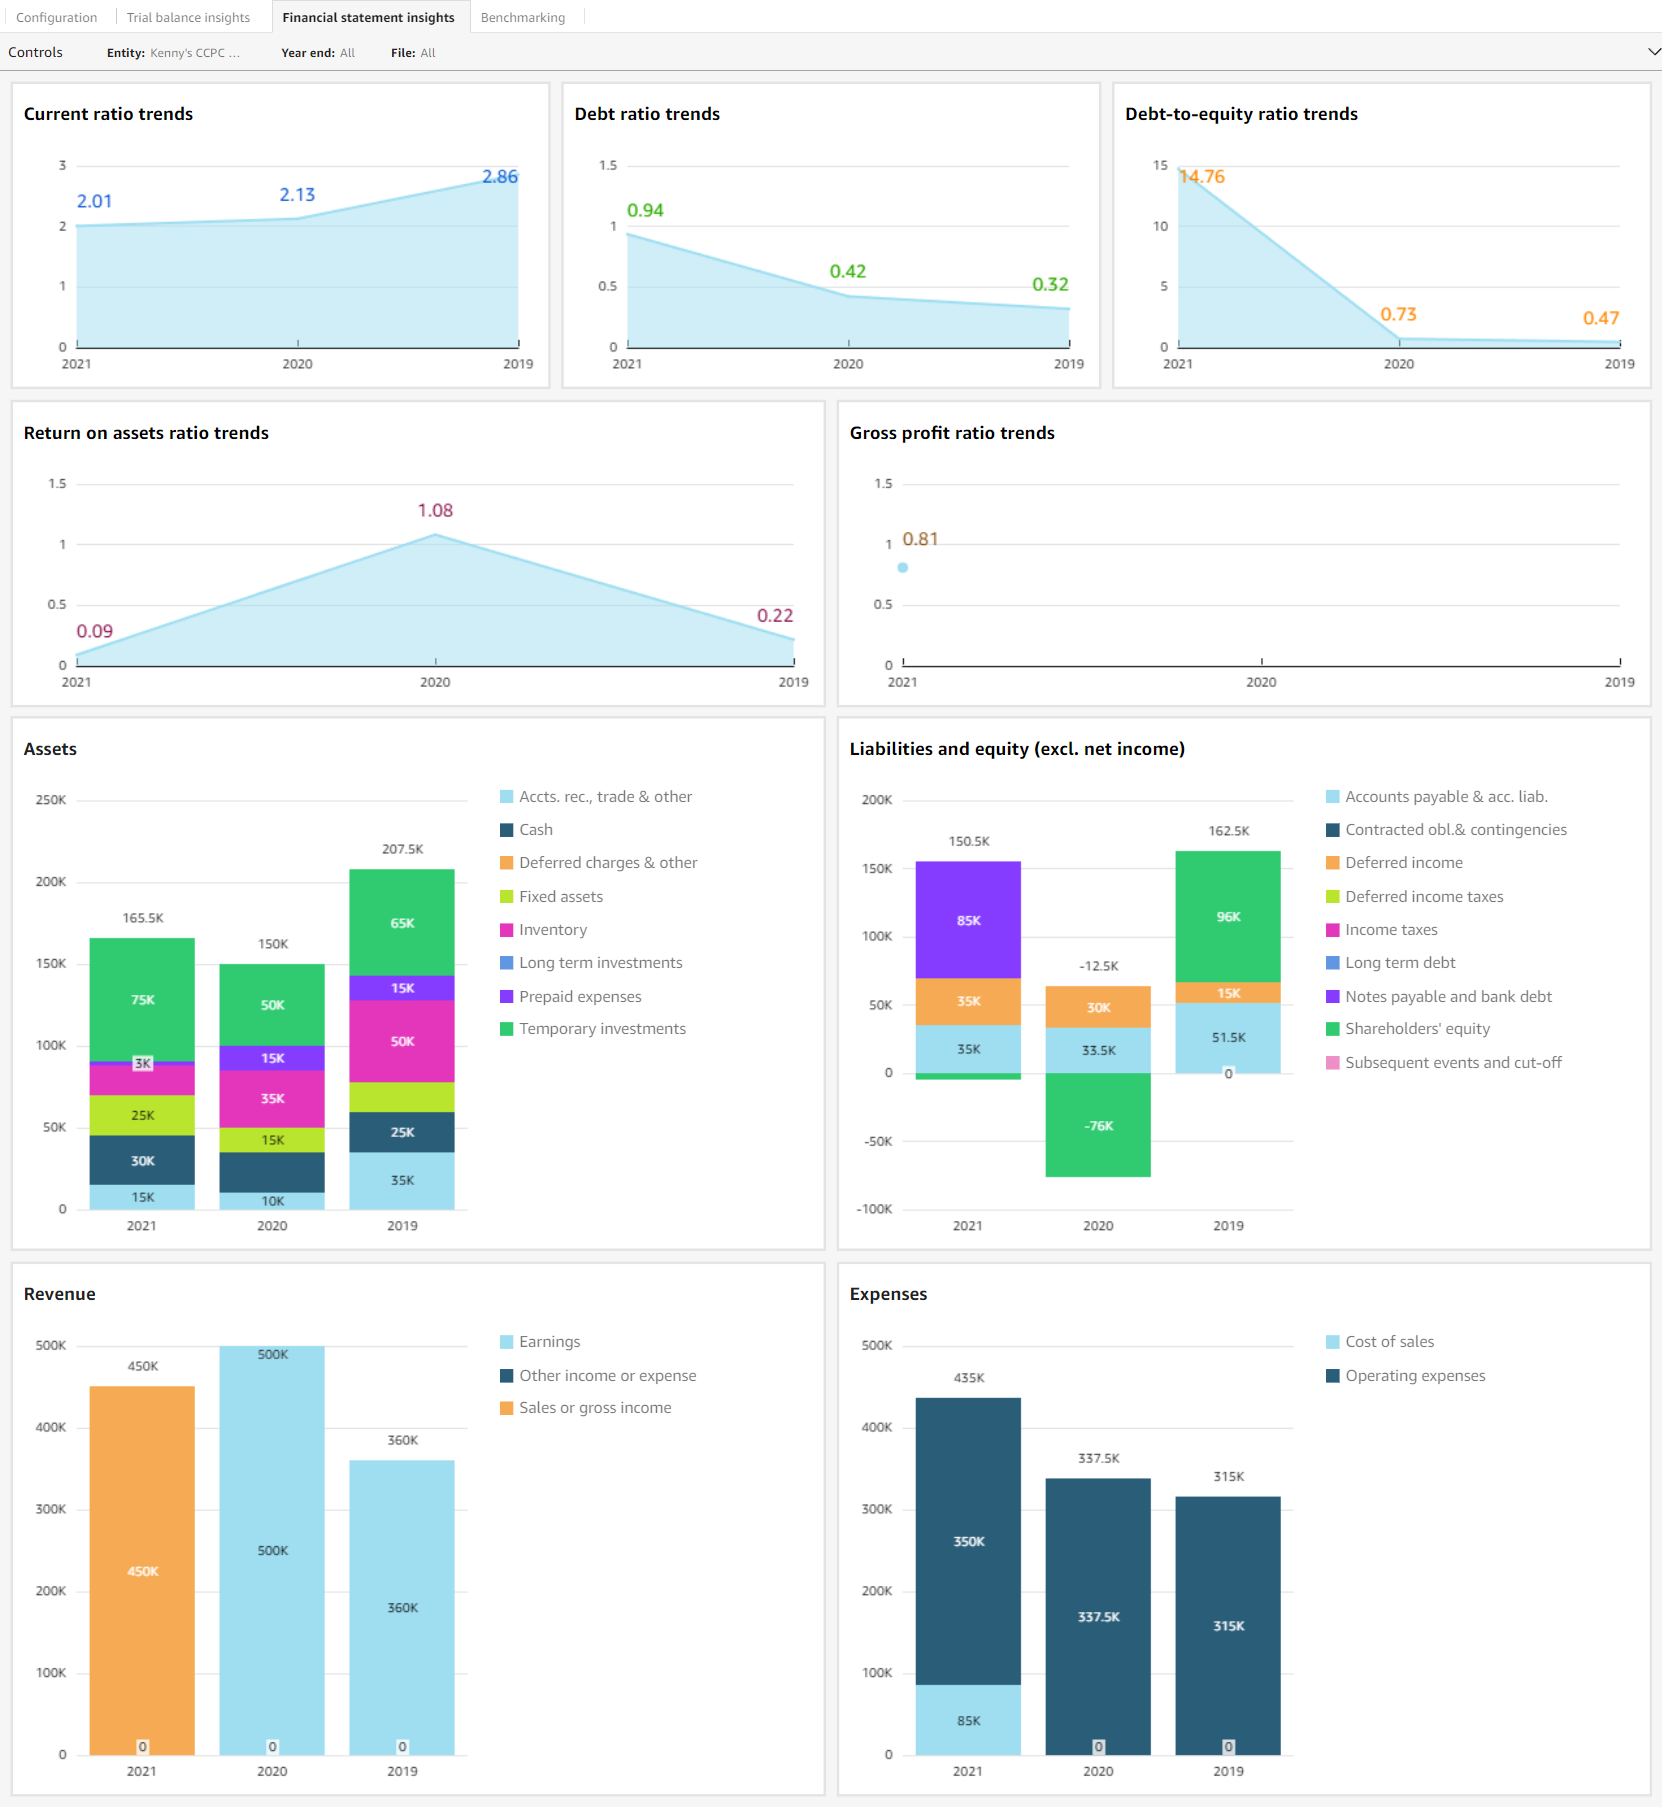
Ajustes a los estados financieros
Nota: Sólo se pueden generar datos comparativos entre archivos que hayan sido subidos a Cloud. Por ejemplo, si su archivo de Nube contiene saldos comparativos de años anteriores, tendrá que cargar el archivo de años anteriores en Nube para que esos datos se muestren en las visualizaciones de Sherlock.
| Widget | Descripción |
|---|---|
| Tendencias actuales de los ratios | Muestra la evolución interanual del ratio actual. Fórmula: Activo circulante / Pasivo circulante |
| Evolución del coeficiente de endeudamiento | Muestra la evolución interanual del ratio de endeudamiento. Fórmula: Total pasivo / Total activo |
| Evolución del ratio deuda/fondos propios | Muestra la evolución interanual del coeficiente de endeudamiento. Fórmula: Total pasivo / Total fondos propios |
| Evolución del coeficiente de rendimiento de los activos | Muestra la evolución interanual del ratio de rentabilidad de los activos. Fórmula: Beneficio neto / Activo total |
| Evolución del beneficio bruto | Muestra la evolución interanual del ratio de beneficio bruto. Fórmula: (Ventas netas - Coste de los bienes vendidos) / Ventas netas |
| Activo | Muestra un desglose de la cuenta de la categoría de activos, año tras año. |
| Pasivo y fondos propios (excl. ingresos netos) | Muestra un desglose de la cuenta de la categoría de pasivo y patrimonio neto, año tras año. |
| Ingresos | Muestra un desglose de la cuenta de la categoría de ingresos, año tras año. |
| Gastos | Muestra un desglose de la cuenta de la categoría de gastos, año tras año. |
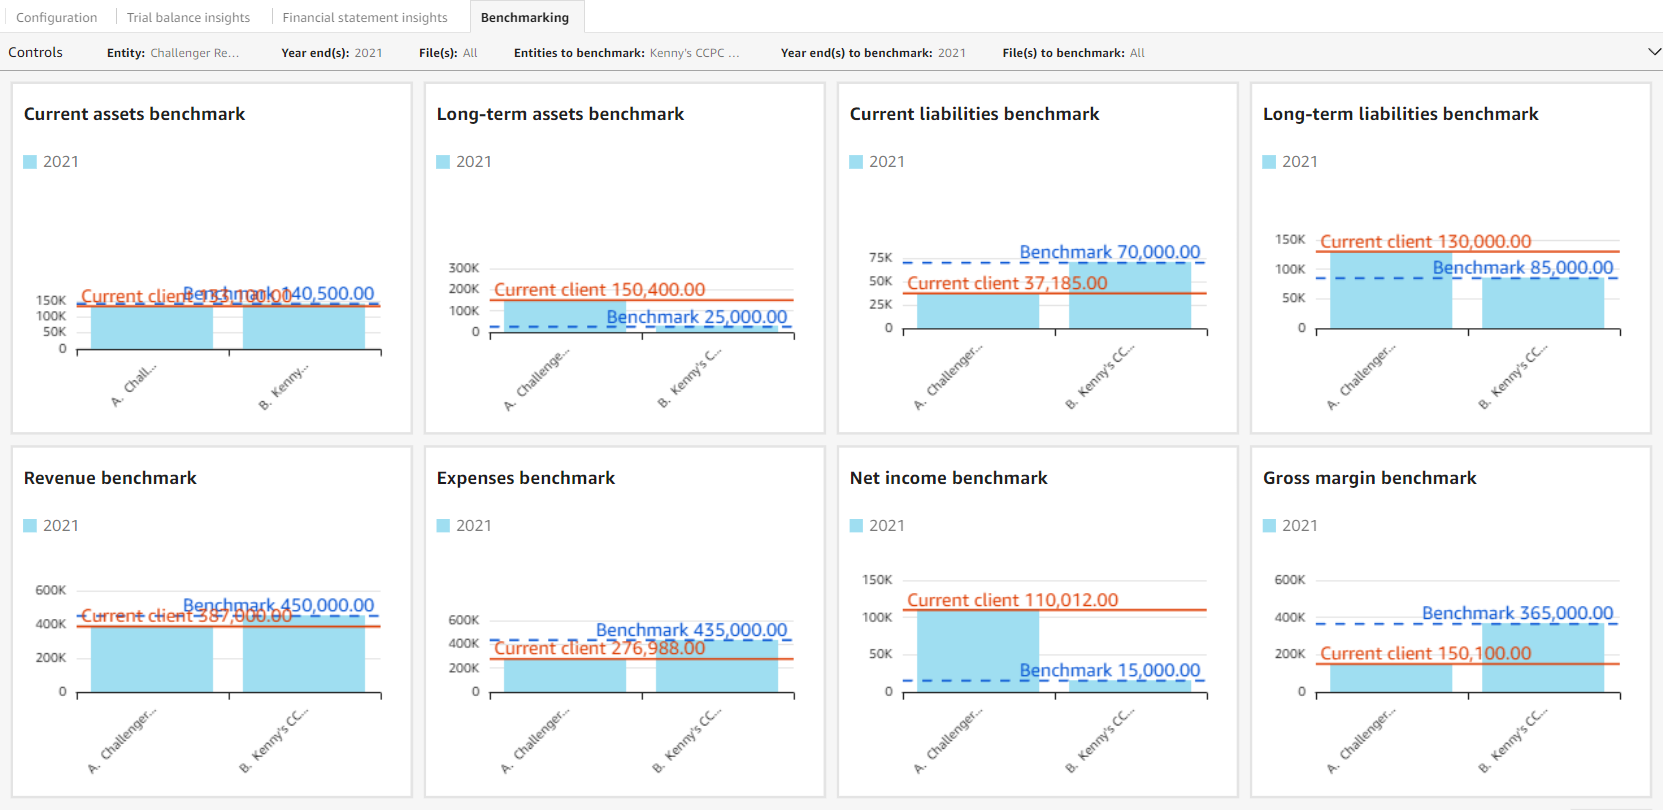
Evaluación comparativa
Notas:
- Sólo se pueden generar datos comparativos entre archivos que hayan sido subidos a Cloud. Por ejemplo, si su archivo de Nube contiene saldos comparativos de años anteriores, tendrá que cargar el archivo de años anteriores en Nube para que esos datos se muestren en las visualizaciones de Sherlock.
- Los datos de evaluación comparativa del año en el control Finde año se mostrarán en los widgets independientemente de si está seleccionado en el control Fin(es) de año a evaluar comparativamente .
| Widget | Descripción |
|---|---|
| Activo circulante de referencia | Compara la categoría de los estados financieros de activo corriente de una entidad con entidades seleccionadas utilizadas como referencia. El valor de referencia se calcula como una media de todos los años y entidades. |
| Activos a largo plazo de referencia | Compara la categoría del estado financiero de los activos a largo plazo de una entidad con entidades seleccionadas utilizadas como referencia. El valor de referencia se calcula como una media de todos los años y entidades. |
| Pasivo corriente de referencia | Compara la categoría del estado financiero del pasivo corriente de una entidad con entidades seleccionadas utilizadas como referencia. El valor de referencia se calcula como una media de todos los años y entidades. |
| Pasivo a largo plazo de referencia | Compara la categoría del estado financiero de pasivos a largo plazo de una entidad con entidades seleccionadas utilizadas como referencia. El valor de referencia se calcula como una media de todos los años y entidades. |
| Ingresos de referencia | Compara la categoría del estado financiero de ingresos de una entidad con entidades seleccionadas utilizadas como referencia. El valor de referencia se calcula como una media de todos los años y entidades. |
| Gastos de referencia | Compara la categoría del estado financiero de gastos de explotación de una entidad con entidades seleccionadas utilizadas como referencia. El valor de referencia se calcula como una media de todos los años y entidades. |
| Beneficio neto de referencia | Compara los ingresos netos de una entidad con los de otras entidades seleccionadas utilizadas como referencia. El valor de referencia se calcula como una media de todos los años y entidades. |
| Margen bruto de referencia | Compara el margen bruto de una entidad con entidades seleccionadas utilizadas como referencia. El valor de referencia se calcula como una media de todos los años y entidades. |