Financial Information
This Sherlock Canada Hybrid Visualization provides insights for a more effective engagement, including:
Each tab includes controls to display data based on the client name and year end.
Note: Prior to using Sherlock visualizations for the first time, you must configure them using the options in the Configuration tab. Some examples of these options include:
- Current assets: Specify the leadsheets that are classified as current assets. These leadsheets will be used to calculate different financial ratios and generate graphs in Sherlock for benchmarking purposes. Note that leadsheets from Working Papers' default leadsheet listing are selected by default, but can be removed if they are not applicable.
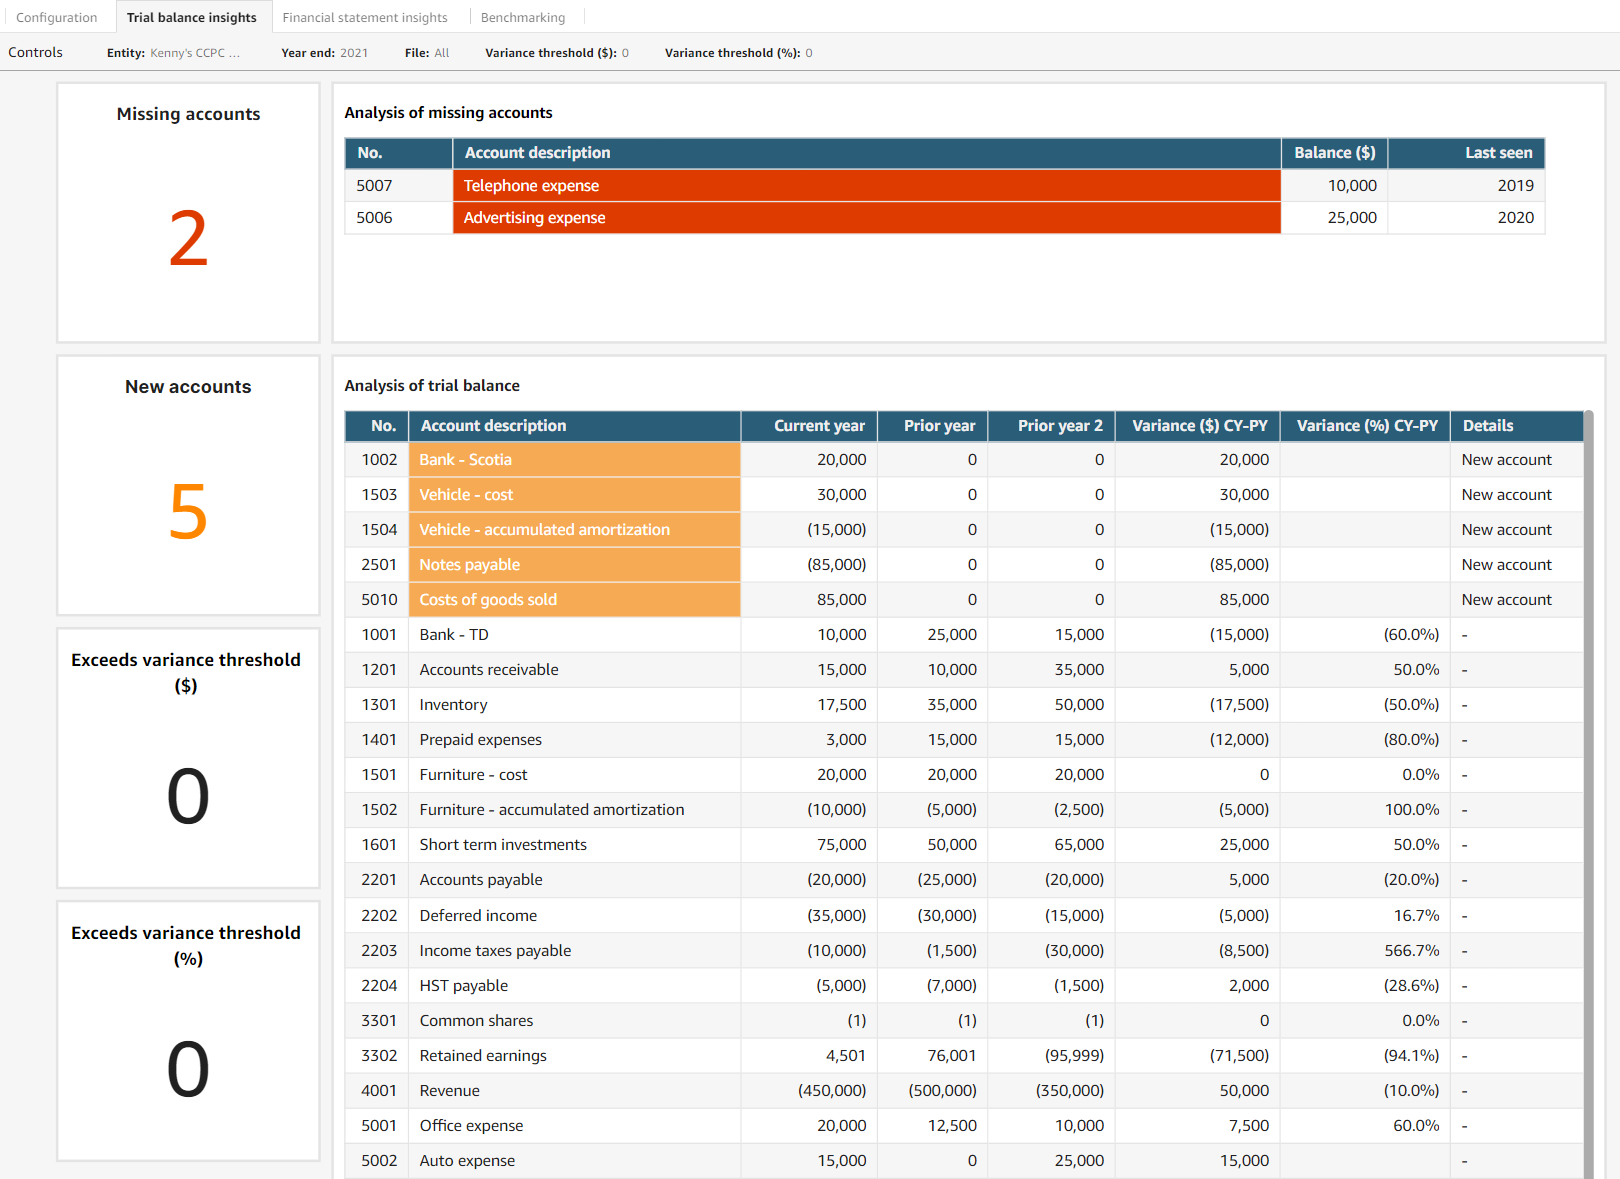
Trial balance insights

| Widget | Beschreibung |
|---|---|
| Missing accounts | Displays the number of accounts that are not included in the current year trial balance, but were present in prior years. |
| Analysis of missing accounts | Displays details of the missing accounts for the selected year. |
| New accounts | Displays the number of new accounts in the engagement for the selected year. |
| Analysis of trial balance | Displays details of the imported trial balance for the selected year. |
| Exceeds variance threshold ($) | Displays the number of accounts with a variance greater than the amount in the Variance threshold ($) control, compared to the prior year. This widget can be used in tandem with the Exceeds variance threshold (%) widget, but will only highlight rows in the Analysis of the trial balance that meet one of the two thresholds, not both. |
| Exceeds variance threshold (%) | Displays the number of accounts with a variance greater than the amount in the Variance threshold (%) control, compared to the prior year. This widget can be used in tandem with the Exceeds variance threshold ($) widget, but will only highlight rows in the Analysis of the trial balance that meet one of the two thresholds, not both. |
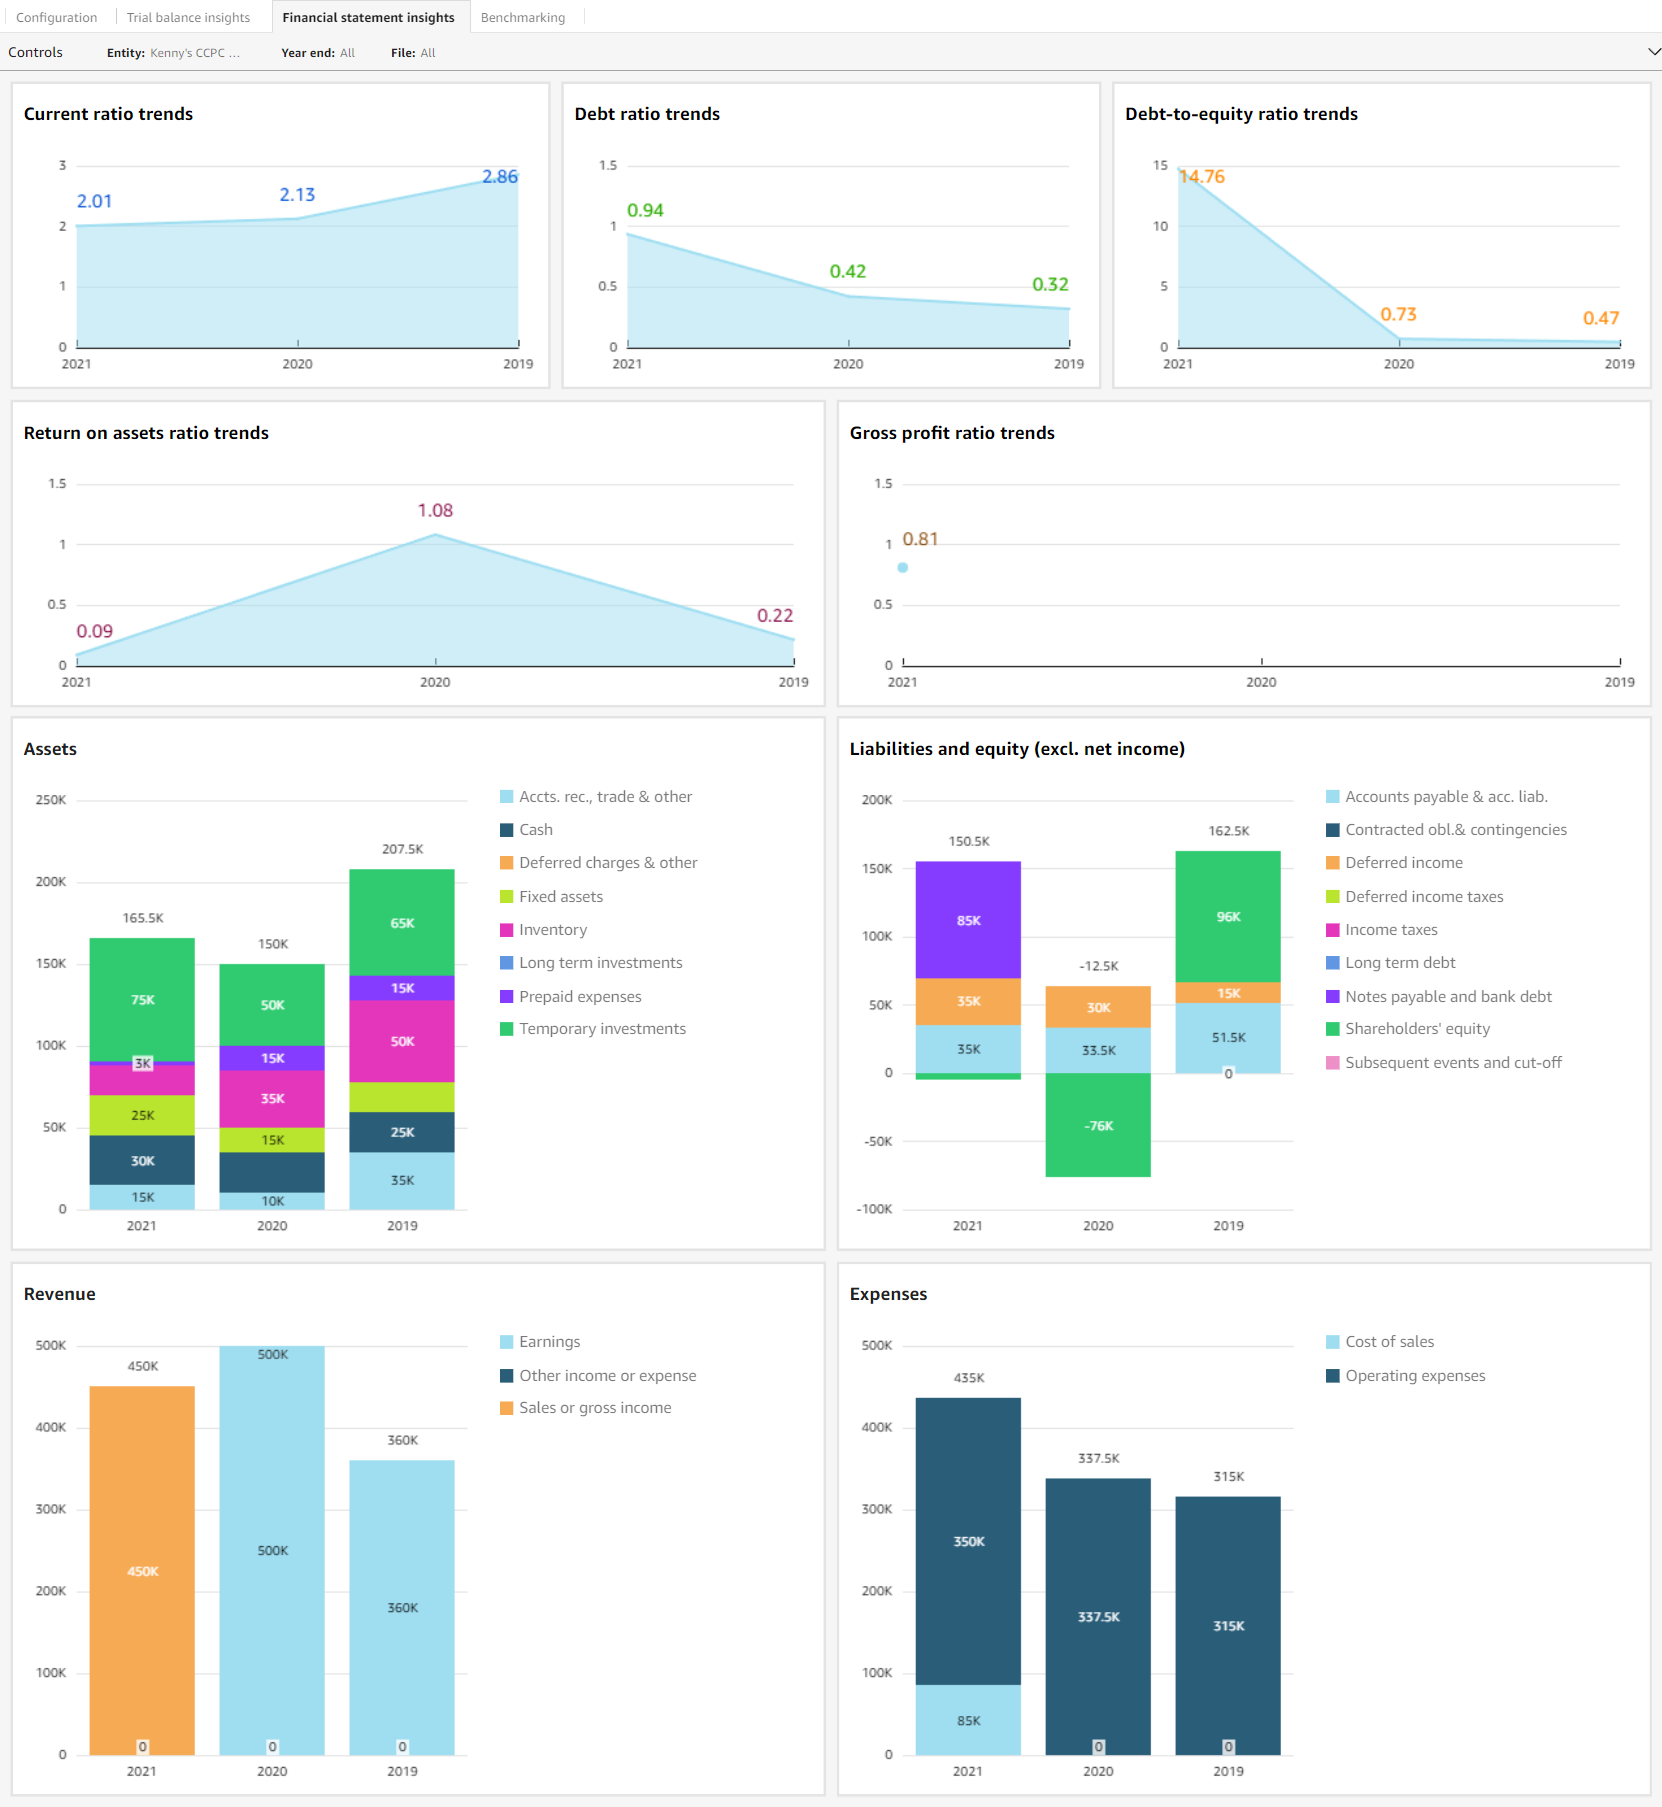
Financial statement insights

Note: You can only generate comparative data between files that have been uploaded to Cloud. For example, if your Cloud file contains prior-year comparative balances, you’ll need to upload the prior-year file to Cloud for that data to display in Sherlock visualizations.
| Widget | Beschreibung |
|---|---|
| Current ratio trends | Displays trends in the current ratio, year-over-year. Formula: Current assets / Current liabilities |
| Debt ratio trends | Displays trends in the debt ratio, year-over-year. Formula: Total liabilities / Total assets |
| Debt-to-equity ratio trends | Displays trends in the debt-to-equity ratio, year-over-year. Formula: Total liabilities / Total equity |
| Return on assets ratio trends | Displays trends in the return on assets ratio, year-over-year. Formula: Net income / Total assets |
| Gross profit ratio trends | Displays trends in the gross profit ratio, year-over-year. Formula: (Net sales - Cost of goods sold) / Net sales |
| Assets | Displays an account breakdown of the assets category, year-over-year. |
| Liabilities and equity (excl. net income) | Displays an account breakdown of the liabilities and equity category, year-over-year. |
| Revenue | Displays an account breakdown of the revenue category, year-over-year. |
| Expenses | Displays an account breakdown of the expenses category, year-over-year. |
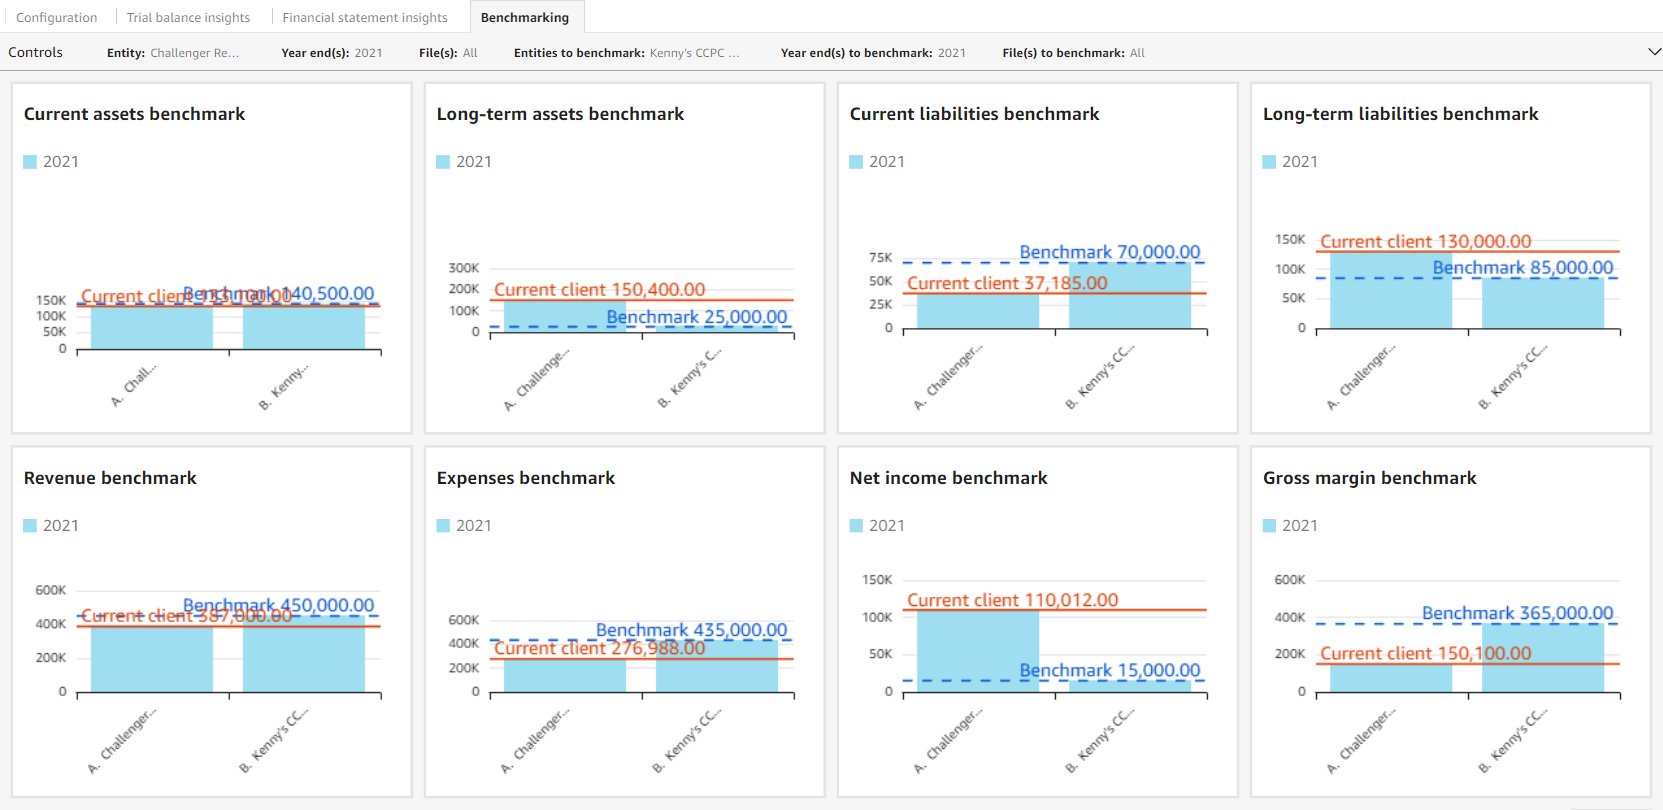
Benchmarking

Hinweise:
- You can only generate comparative data between files that have been uploaded to Cloud. For example, if your Cloud file contains prior-year comparative balances, you’ll need to upload the prior-year file to Cloud for that data to display in Sherlock visualizations.
- Benchmarking data from the year in the Year end control will display in widgets regardless of whether it is selected in the Year end(s) to benchmark control.
| Widget | Beschreibung |
|---|---|
| Current assets benchmark | Compares an entity’s current asset financial statement category against selected entities used as a benchmark. The benchmark is calculated as an average across years and entities. |
| Long-term assets benchmark | Compares an entity’s long-term assets financial statement category against selected entities used as a benchmark. The benchmark is calculated as an average across years and entities. |
| Current liabilities benchmark | Compares an entity’s current liabilities financial statement category against selected entities used as a benchmark. The benchmark is calculated as an average across years and entities. |
| Long-term liabilities benchmark | Compares an entity’s long-term liabilities financial statement category against selected entities used as a benchmark. The benchmark is calculated as an average across years and entities. |
| Revenue benchmark | Compares an entity’s revenue financial statement category against selected entities used as a benchmark. The benchmark is calculated as an average across years and entities. |
| Expenses benchmark | Compares an entity’s operating expenses financial statement category against selected entities used as a benchmark. The benchmark is calculated as an average across years and entities. |
| Net income benchmark | Compares an entity’s net income against selected entities used as a benchmark. The benchmark is calculated as an average across years and entities. |
| Gross margin benchmark | Compares an entity’s gross margin against selected entities used as a benchmark. The benchmark is calculated as an average across years and entities. |
