Add an analysis section in the financial statements
You can add an analysis section in the financial statements to include a visual representation of the data through tables, graphs and charts.
To add an Analysis section:
-
Locate where you want to add the analysis section.
-
You can add an analysis section in an area or a note or a note heading.
-
Go to the left side of the page and select Add (
 ).
). -
Choose Analysis from the list of content types.
-
A list of the available tables, charts and graphs display.
-
Select the desired figure to add it in the analysis section.
Note: Items in this list differ based on your product setup.
Note: The data displayed in the analysis section reflects the balances in the financial statements not the trial balance. Financial statements balances can include overridden values and adjustments.
You can make a few modifications to the figures to customize the look of the section and data presentation.
To customize charts, graphs and tables:
-
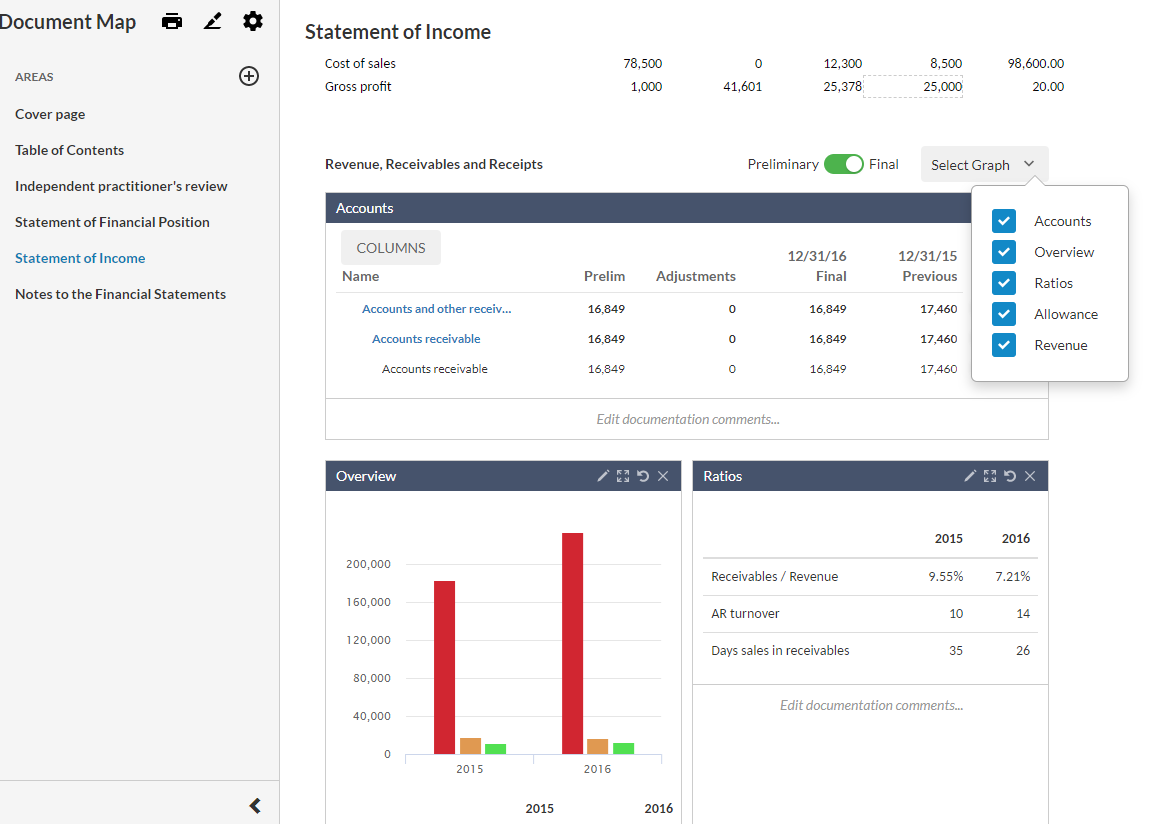
At the Select Graph drop-down, choose the figures you want to include in the section.
-
Use the preliminary/final switch (
 ) to select whether you want to view preliminary or final data in the figures.
 -
Select the Full size icon (
 ) to display the figure in a full size across the section.
 -
Select the Edit icon (
 ) in the figure's title bar, then select the Add icon (
 ) to add an item to the chart. Select an item from the displayed list to add it to the figure.
 -
Select Edit documentation comments… to display a text box where you can add comments.
-
In tables, select the COLUMNS button to specify the columns you want to display in a specific table.
Tip: You can also close a figure (![]() ) to have it removed from the section.
) to have it removed from the section.
If you want to reset a figure to its original state, select the Reset to default icon (![]() ).
).