Überblick Engagementstatus anzeigen
Caseware Cloud kann eingesetzt werden, um sich an einer zentralen Stelle einen umfassenden Überblick über all Ihre Engagements zu verschaffen, so dass schnell Trends oder Probleme erkannt werden. In Abhängigkeit von Ihren organisatorischen Anforderungen, bietet Caseware Cloud eine Vielzahl von Möglichkeiten, um Daten zu präsentieren:
Ihre Daten in einem Dashboard anzeigen
Dashboards können in Caseware Cloud eingesetzt werden, um Informationen zu visualisieren und Ihnen ein Gesamtbild der Ausführung Ihrer Engagements anzubieten.
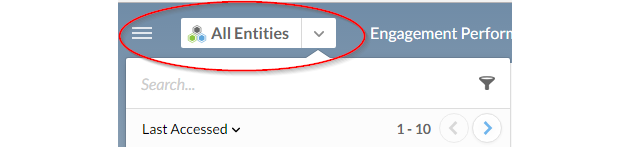
Sie können einen Drill-down der Daten ausführen, um entitätsspezifische Daten anzuzeigen, indem Sie die Entität in der Entitätsauswahl wählen.
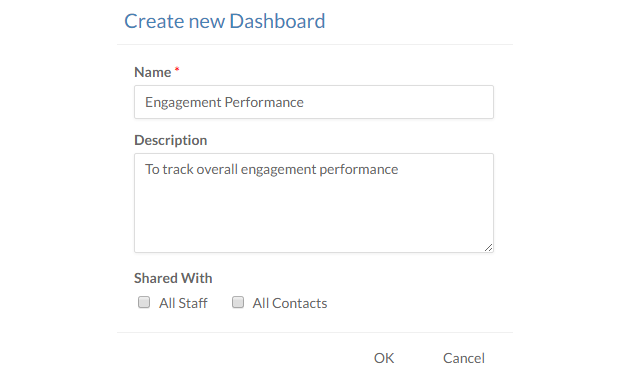
Ein Dashboard erstellen
Sie können Ihr Dashboard nach Ihren Wünschen zusammenstellen - mit einer Sammlung integrierter Gadgets in Abhängigkeit von den aktivierten Apps.
To create a dashboard:
-
From the Cloud menu, select Dashboards(
 ).
). -
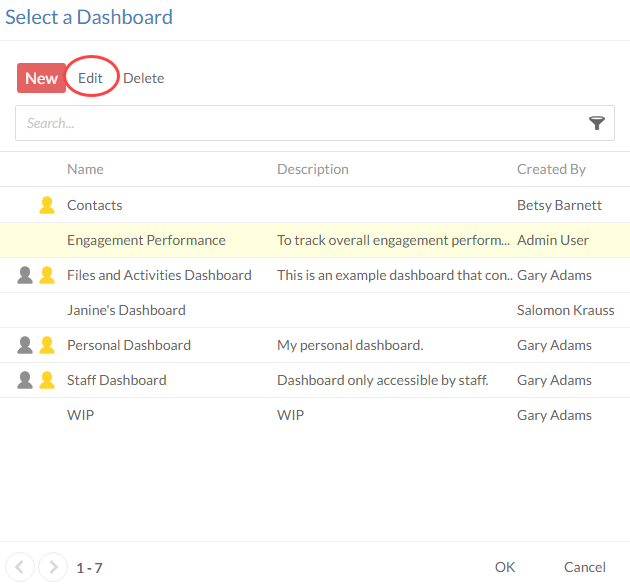
In the Select a Dashboard dialog, select New.
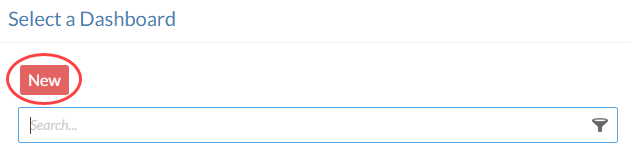
-
Name your dashboard, enter an optional description and select OK.
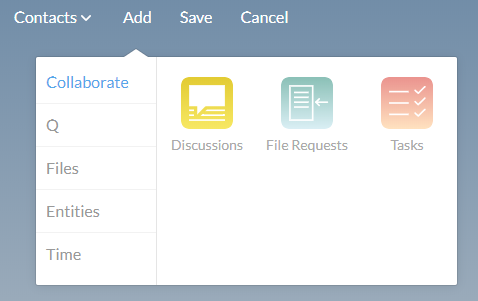
Gadgets hinzufügen
Nachdem Sie Ihr privates Dashboard erstellt haben, werden Sie in den Anpassungsmodus versetzt, in dem Sie Gadgets zum Dashboard hinzufügen, die Ihren Anforderungen entsprechen.
To add gadgets to a dashboard:
-
Ensure you have the Editor role or equivalent.
-
From the Cloud menu, select Dashboards (
). - Select the dashboard you want to add gadgets to.
-
If no gadgets are in the dashboard, the dashboard will open with the Add gadgets drop-down collapsed.
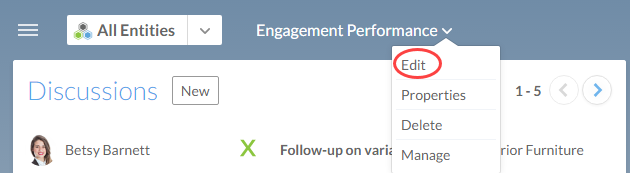
If you are adding gadgets to an existing dashboard, then you will need to select the Dashboard drop-down and select Edit to enter editing mode.
-
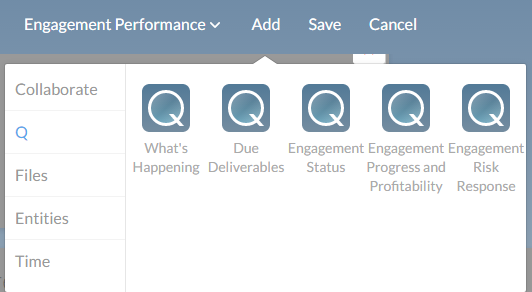
Select from the collection of built-in gadgets depending on which apps are enabled. For a list of all available gadgets, see Dashboard Gadgets.
Hinweis: You can only add one gadget type to a dashboard.
Aussehen von Gadgets anpassen
Nach dem Hinzufügen Ihrer Gadgets in das Dashboard können Sie die Anzeige des Gadgets im Dashboard anpassen. Die folgenden Optionen stehen zur Verfügung:
- Ordnen Sie die Gadgets neu an, indem Sie per Drag-and-Drop das Gadget an den neuen Standort ziehen. Gadgets werden automatisch an ein vordefiniertes Gitter angepasst und können nicht auf andere Gadgets verschoben werden.
-
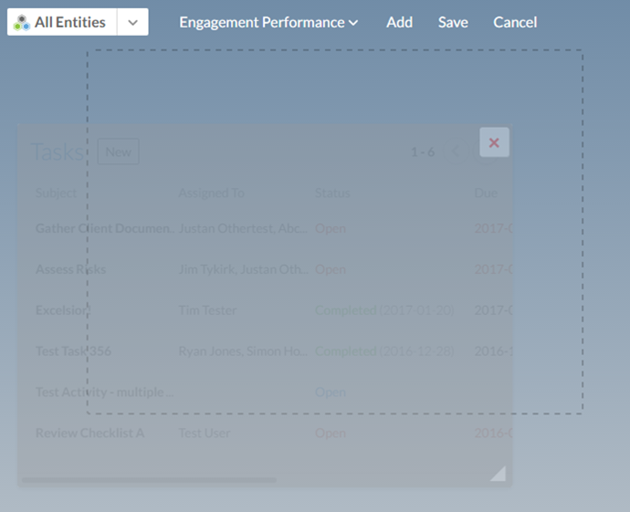
Sie können Gadgets anpassen, indem Sie auf die Schaltfläche Größe anpassen klicken und durch Ziehen den rechten und unteren Rand des Gadgets verschieben.
-
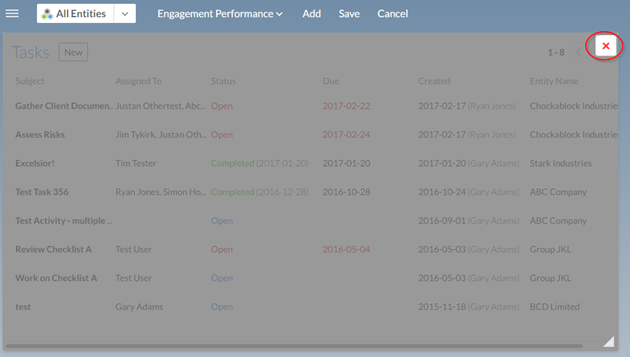
Sie können Gadgets löschen, indem Sie auf die Schaltfläche Entfernen in der Gadget-Kopfzeile klicken.
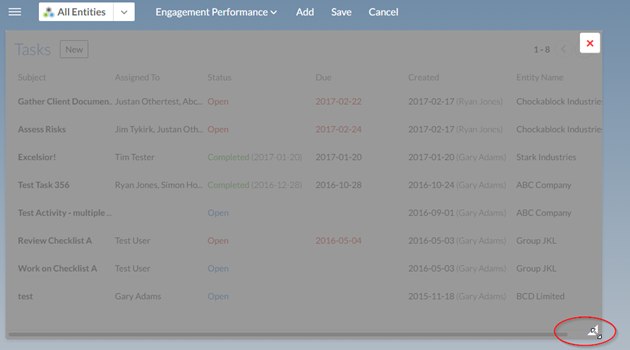
Datei-Gadgets filtern
Datei-Gadgets können gefiltert werden, um Dateien basierend auf einer Ansicht oder ausgewählten Filtern anzuzeigen. So möchten Sie vielleicht alle Dateien anzeigen, für die ein zweiter Review erforderlich ist, um die Gesamtleistung des Engagements zu beurteilen.
To filter file gadgets:
-
Ensure you have the Editor role or equivalent.
-
From the Cloud menu, select Dashboards (
). -
Select the applicable dashboard and enter editing mode by selecting Edit in the Dashboard drop-down.
-
On a File Gadget, select the gear(
 ) in the gadget header to open available filter options.
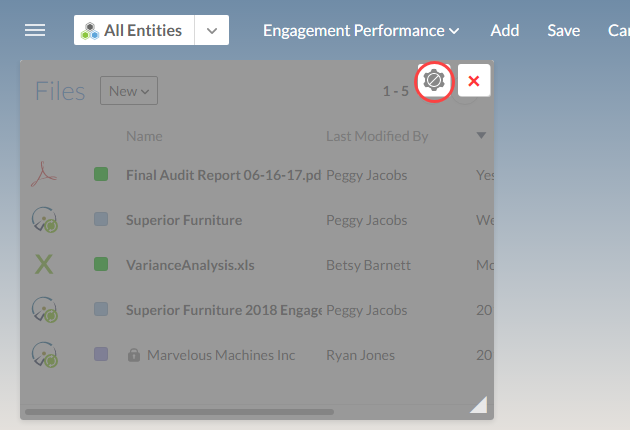
-
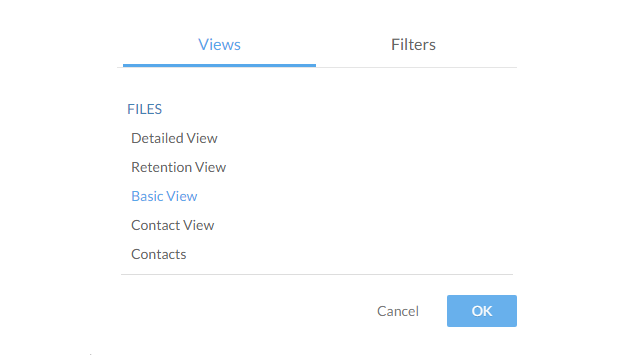
Select the Views tab to select to filter based on a view or select the Filters tab to add multiple filters.
-
Klicken Sie auf die Schaltfläche OK.
Das Dashboard für Andere freigeben
Sobald Sie Ihr Dashboard konfiguriert haben, können Sie es für andere Mitarbeiter und Kontakte freigeben.
To share a dashboard:
-
Ensure you have the Editor role or equivalent.
-
From the Cloud menu, select Dashboards (
). -
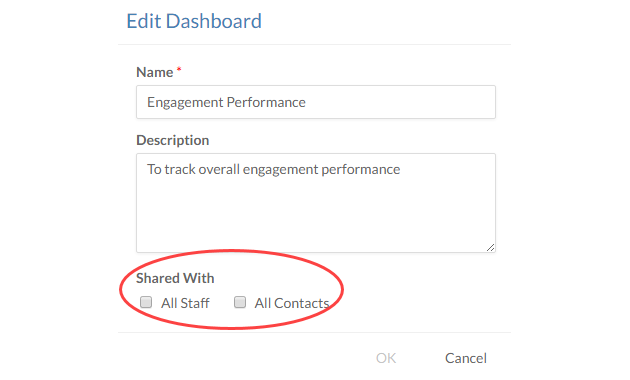
Select the applicable dashboard in the Select a Dashboard dialog and select Edit.
-
Select to share with All Staff and All Contacts.
-
Klicken Sie auf die Schaltfläche OK.
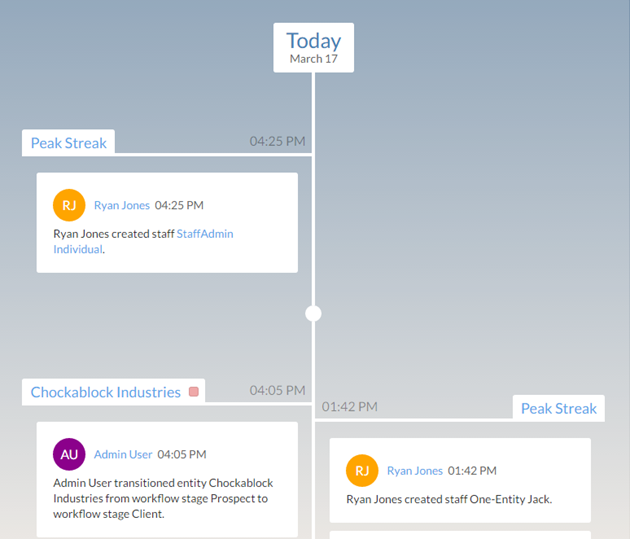
Die Zeitachse verwenden
Die Zeitachse repräsentiert eine neue Möglichkeit, um alle Aktivitäten in Ihrem Unternehmen auf einen Blick anzuzeigen und zu verfolgen. Die Zeitachse zeigt eine detaillierte Ansicht von allen Aktivitäten und Kommentaren mit Uhrzeit und Datum der Ausführung an, die in Ihren Entitäten vorgenommen wurden.
Sie können die Liste nach Entitäten filtern, indem Sie die entsprechende Entität mit Hilfe der Entitätsauswahl wählen.
Die Zeitachse wird aktualisiert, wenn eine neue Aktivität gepostet wird. Wenn Sie im Rückstand sind, wird eine Eingabeaufforderung angezeigt, die Sie zur Aktualisierung auffordert.

Using Caseware Q

This section describes functionality only available with Caseware Audit.
If you would like an out of the box solution that provides you predefined views and additional widgets to obtain key data for engagements for the organization to monitor various metrics across the organization's entire client base then Caseware Q is your solution. With Caseware Q, you can focus on improving your audit quality, which in turn will improve your audit process and your organization's quality.
Caseware Q is a free add-on in all of our supported Caseware Audit Template. If you are considering of using this out-of box solution and have not picked up the Audit International Template. Contact our sales team for more information.
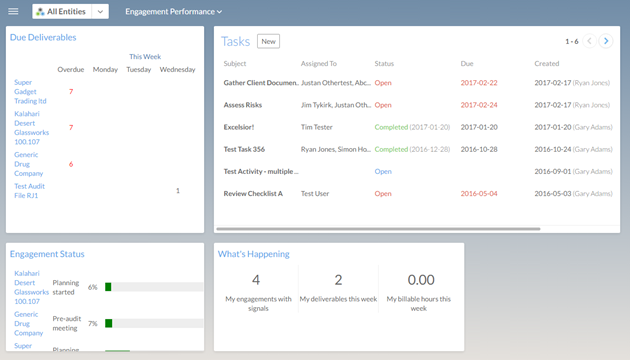
Landing Page
Once you have Caseware Q setup, you can use Q to visualize the overall engagement status by accessing Caseware Q landing page.
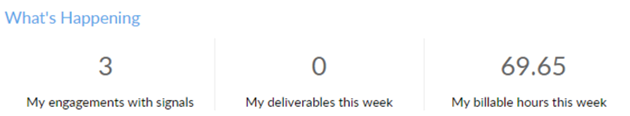
The Caseware Q landing page has three different sections:
What's Happening - Provides you an overall summary of how many files have Caseware Q setup, any due deliverables that are due this week and the billable hours this week.
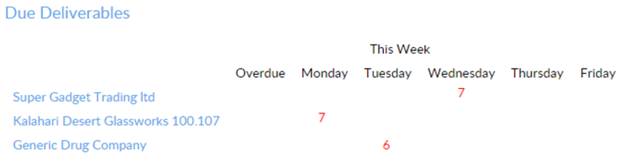
Due Deliverables - Shows you how many due deliverables are due this week. These deliverables are set in the Audit template using the Caseware Q document.
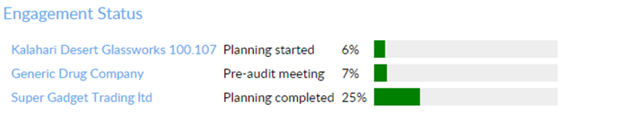
Engagement Status - The completion rate is based on the percentage weight for each document completed and reviewed in the Audit template.
Engagement file details
With Q-enabled files, you get a more comprehensive view of your engagement file where you can obtain important metrics to ensure you are providing efficient and effective engagements.
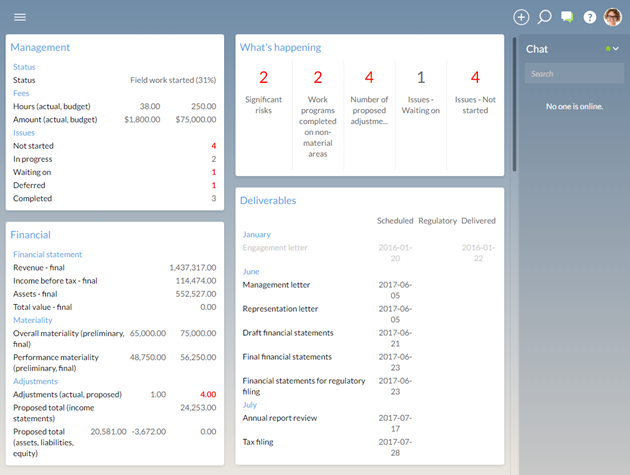
To access these details, select an engagement from the Q landing page.
Dashboard widgets
Caseware Q contains a variety of built-in widgets from tracking all your engagement status to tracking engagement progress and profitability.
Caseware Q views
You can use out of the box views with Caseware Q to provide you the necessary columns in the Files, Entities, Staff and Contacts apps that are pertinent to you. Q has organized views into:
- Overview View
- Management View
- Financials View
- Risk Assessment View
- Engagement Information View
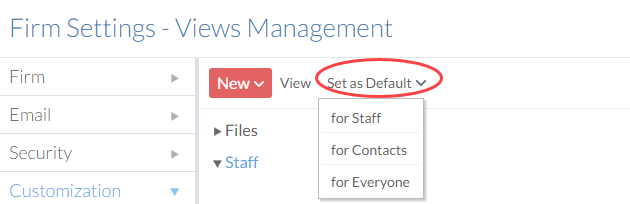
Caseware Q views columns cannot be customized but you can select the default view that appears for staff, contacts or everyone.
To change the default view:
-
Vergewissern Sie sich, dass Sie über die Rolle Administrator verfügen.
-
From the Cloud menu, select Settings.
-
Wählen Sie Anpassung | Ansichten verwalten.
-
Select the view you want to set as default
-
Select the Set as Default and select the appropriate group.