View the client's trial balance data
Once you've received and successfully imported your client's trial balance data, you can view accounts and groups using the left panel on the Data page.
View accounts
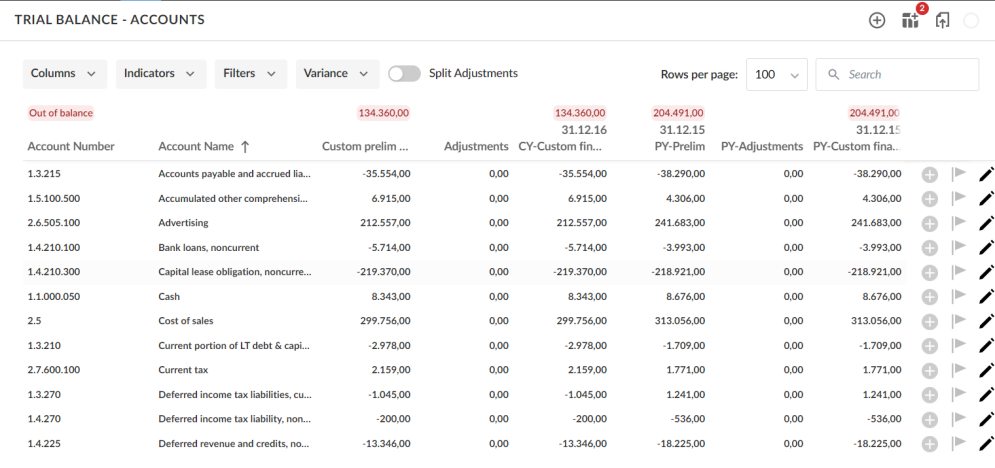
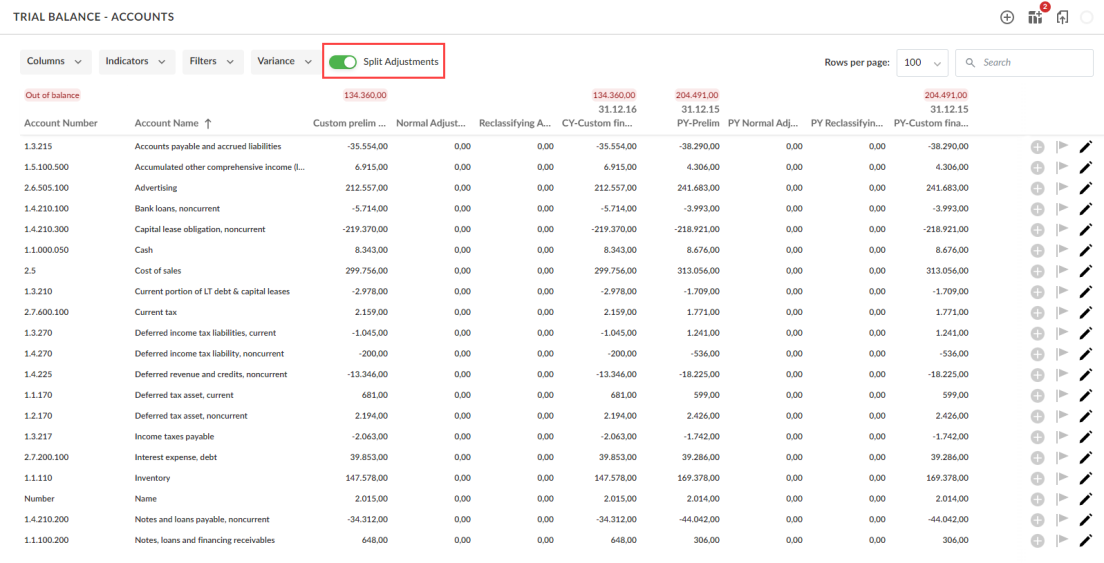
The Accounts tab in the left panel displays your client's accounts data. It mainly shows account numbers, names, preliminary balances (imported balances), final balances (after adjustments, rounding, etc.) and previous (prior year) balances.
Note: Based on your product setup, the Preliminary and Final column titles may be different.
If the trial balance is unbalanced, the Out of balance ( ) indicator displays at the top of the page. The amount by which the data is out of balance also displays at the top.
You can sort the data in each column in an ascending order or a descending order by selecting the column. An upward arrow (![]() ) or a downward arrow (
) or a downward arrow (![]() ) displays on the page to indicate whether the data is sorted in ascending or descending order.
) displays on the page to indicate whether the data is sorted in ascending or descending order.
You can use the Rows per page dropdown to choose how many data rows to display on each page. The default is 100 rows.
The drop-downs at the top of the Accounts tab allow you to include more columns or indicators in the page and filter the data.
To view additional data in the Accounts tab:
-
Select the Columns drop-down.
-
Select the check box next to the column you want to view.
- Variance
- Variance percentage
- Area
- Cycle
- Tax adjustments
- Tax code
A list of the available columns displays.
Available options include:
To include additional indicators in the Accounts tab:
-
Select the Indicators drop-down.
-
Select the check box next to the indicator you want to view.
- Issues
- Annotations
- Materiality
A list of the available indicators displays.
Available options include:
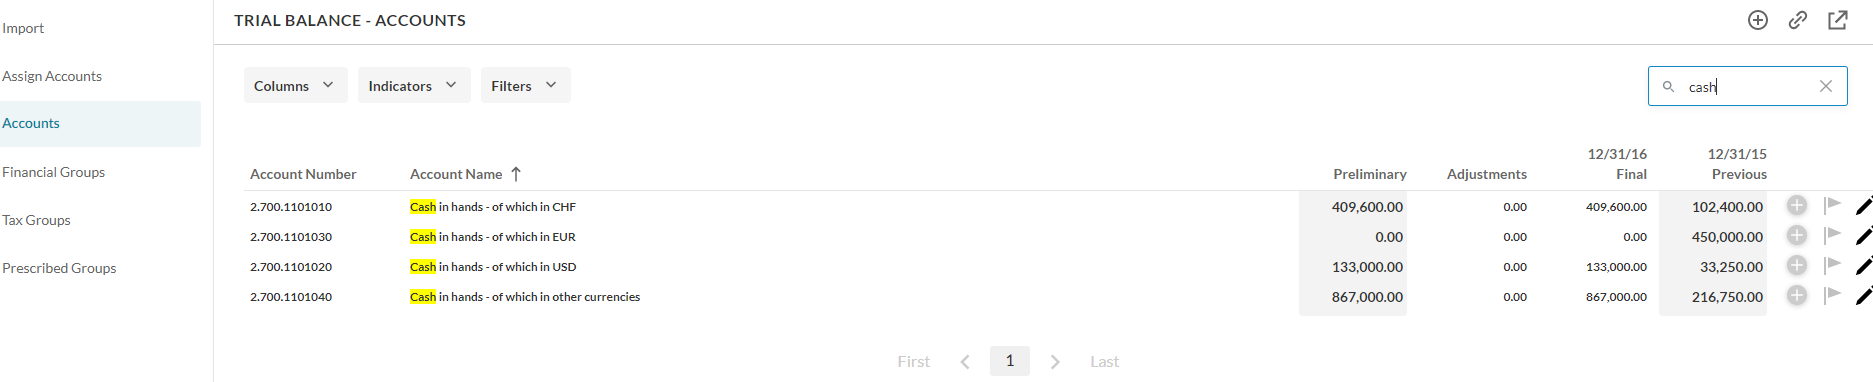
You can also search the page by entering keywords in the Search field at the top. Matching results are highlighted and displayed once you start typing.
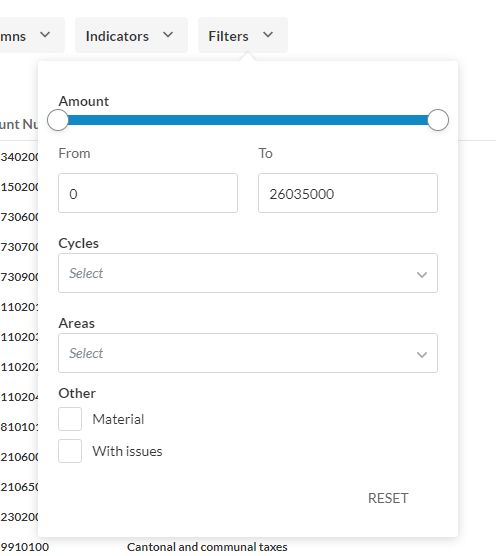
You can also filter the data on the page as desired. Select the Filters drop-down to specify a filter option:
-
At Amount, you can enter a range for the balances (From and To) so you only view account balances within that range. You can also use the slider to specify the range.
-
At the Cycles drop-down, you can filter the displayed accounts based on the selected cycle.
-
At the Areas drop-down, you can filter the displayed accounts based on the selected area.
-
You can select the Material check box to only display material accounts.
-
You can select the With issues check box to only display accounts with recorded issues.
You can also view transactions for each account. To learn more, see View account transactions.
View groups
Three main group tabs can be available to you at the left panel:
-
Financial Groups - displays the financial groups. This is the default grouping structure that the client's trial balance data is mapped into. This tab is always available to you once you import the client's data. Note that if your product has multiple financial grouping structures, you may see up to three financial groups tabs.
-
Tax Code - displays the Tax Code groups. This tab is only available on the page if the Tax Code grouping structure is used in your product.
-
Chart of Accounts - displays the Chart of Accounts. This tab is only available on the page if a standard Chart of Accounts is used in your product.
Note: FINANCIAL GROUPS tab is always available on the page. TAX GROUPS and PRESCRIBED GROUPS are only available on the page if Tax Code or Chart of Accounts grouping structures are enabled in your product.
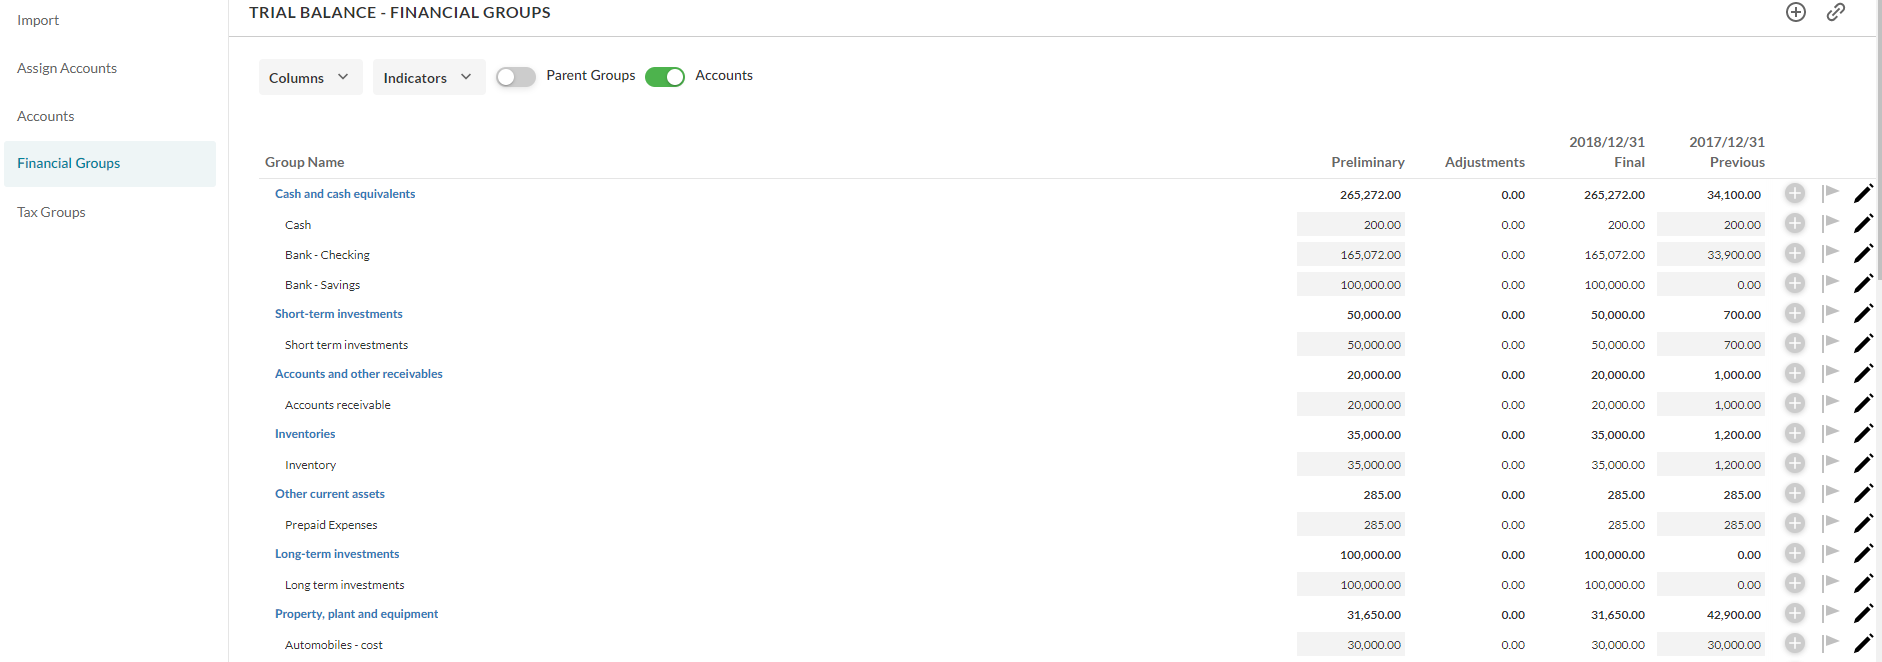
Notice how group names display in blue while account names display in black.
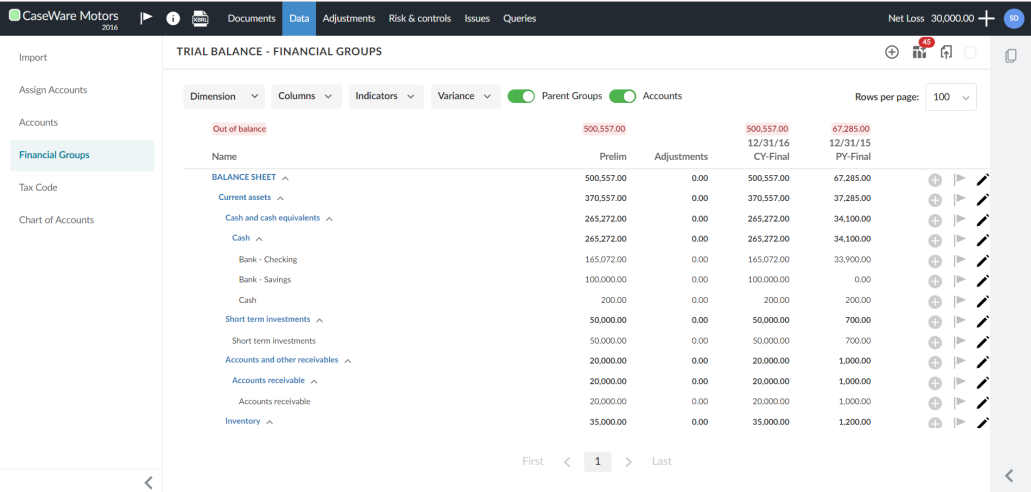
If the trial balance is unbalanced, the Out of balance () indicator displays at the top of the page. The amount by which the data is out of balance also displays at the top.
You can use the Rows per page dropdown to choose how many data rows to display on each page. The default is 100 rows.
You can collapse and expand groups using the Collapse (![]() ) and Expand (
) and Expand (![]() ) icons. When all subgroups at the same level are collapsed, you can drag and drop them to rearrange them using the Rearrange (
) icons. When all subgroups at the same level are collapsed, you can drag and drop them to rearrange them using the Rearrange (![]() ) icon.
) icon.
The drop-downs at the top of the group tabs allow you to include more columns or indicators in the page.
To view additional data in the group tabs:
-
Select the Columns drop-down.
-
Select the check box next to the column you want to view.
- Variance
- Variance percentage
- Area
- Cycle
- Tax adjustments
- Tax code
A list of the available columns displays.
Available options include:
To include additional indicators in the group tabs:
-
Select the Indicators drop-down.
-
Select the check box next to the indicator you want to view.
- Issues
- Annotations
- Materiality
A list of the available indicators displays.
Available options include:
To filter by dimension in the group tabs:
-
Select the Dimension drop-down.
A list of the available dimensions displays.
-
Select the dimension you want to view.
You can also use the Search box to find the dimension in the list.
To hide the accounts and display groups only, disable the Accounts option.
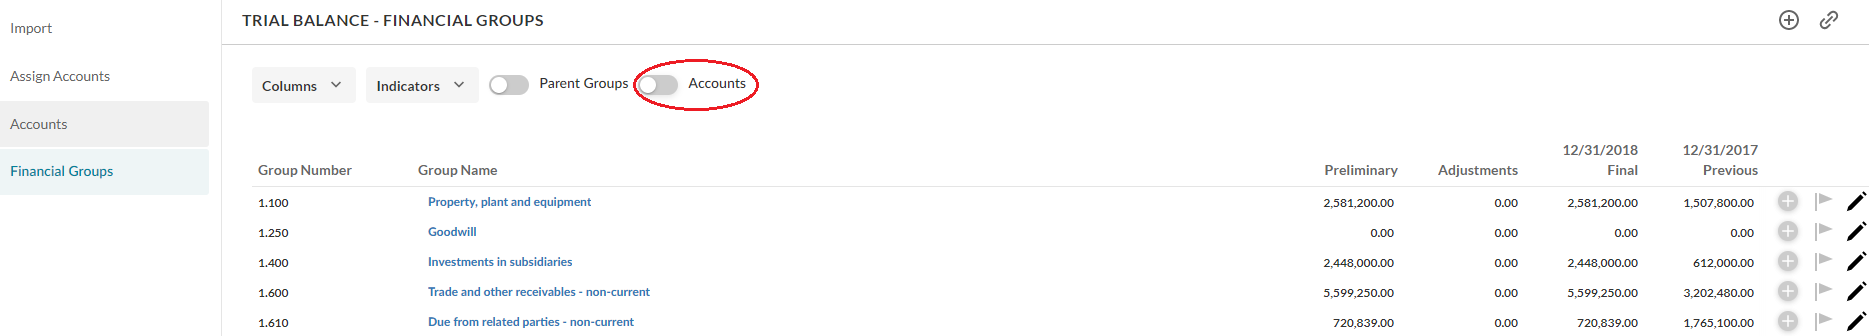
The groups that show on the page by default are based on your product setup. If no default groups have been set up in your product, the page displays all groups in the hierarchy.
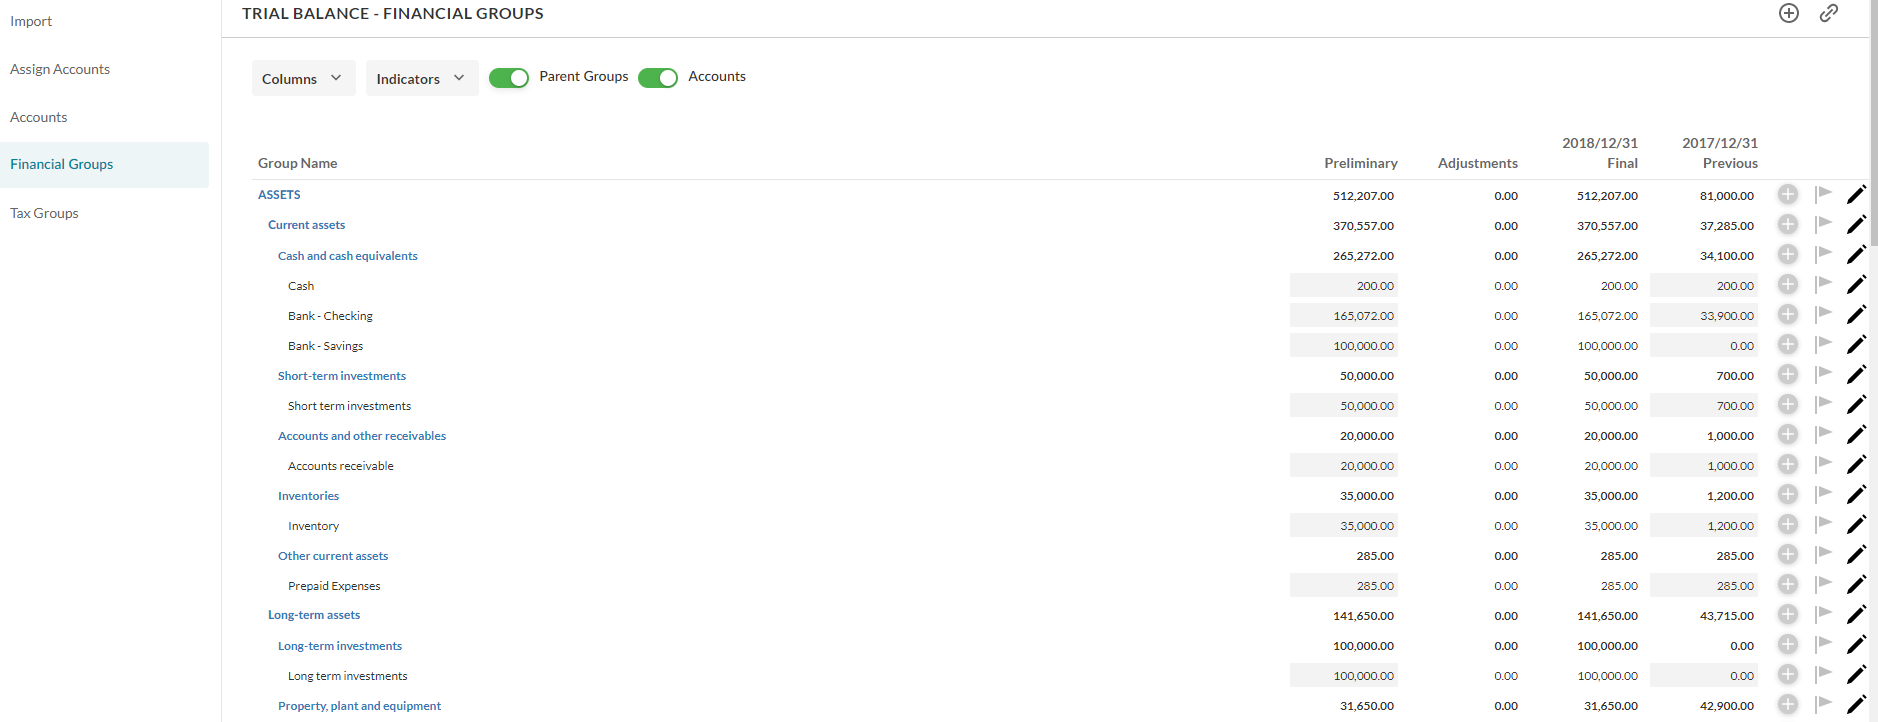
If you have default groups defined in your product, you can view the parent groups for the default groups by enabling the Parent Groups option.
For example, in the below figure, default groups have been set up in the product, so the page displays the following groups by default.
If you enable the Parent Groups option, the page displays all levels above the default group in the hierarchy (that is, the parent groups for each default group). Note that if no default groups are defined, enabling this option has no effect on the page.
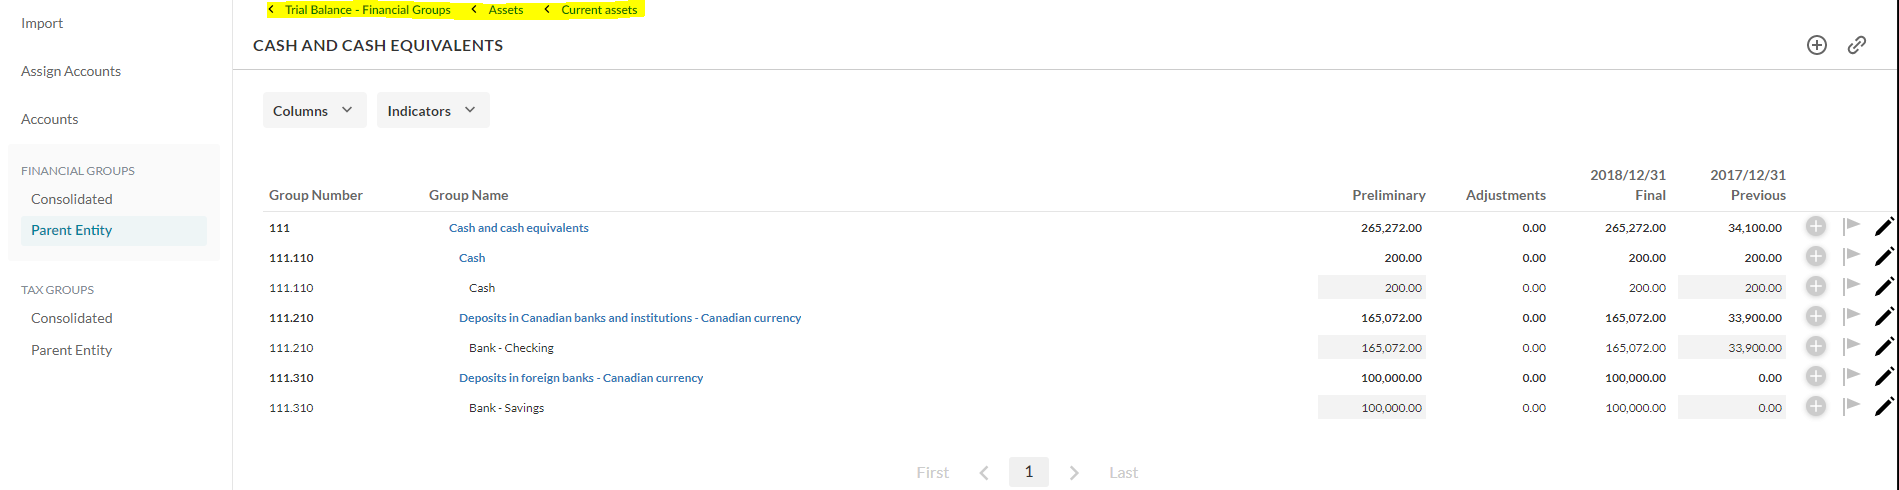
You can also select a specific group to view a drill-down of its subsequent groups only on the page. For example, you can select Current assets to view its subsequent groups only on the page. Notice how a navigation path displays at the top of the page so you can easily navigate to parent groups.
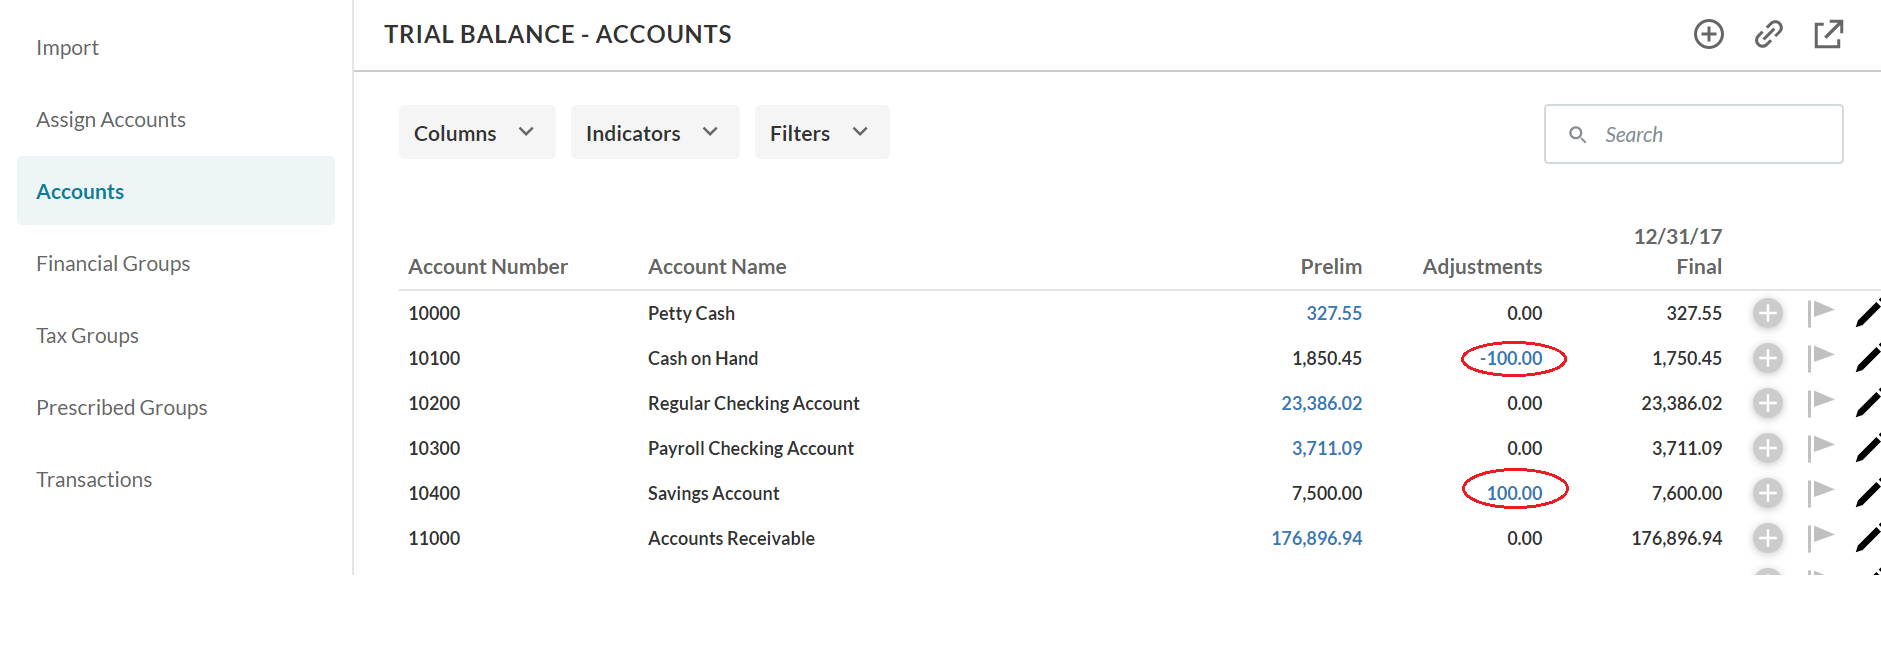
View adjustment details
If there are adjusting entries posted for specific groups or accounts, you can directly navigate from the Data page to the Adjustments page, where you can view the details of each adjusting entry.
Note: The Adjustments column must be visible in the Data page. Make sure you select Adjustments check box from the Columns drop-down.
If the Split Adjustments toggle is available in your product, you can turn it on to view normal and reclassifying adjustments in separate columns.
To view the details of an adjustment:
-
Go to the Adjustments column.
-
Select the adjustment you want to view its detail.
Adjustments display in a blue color.
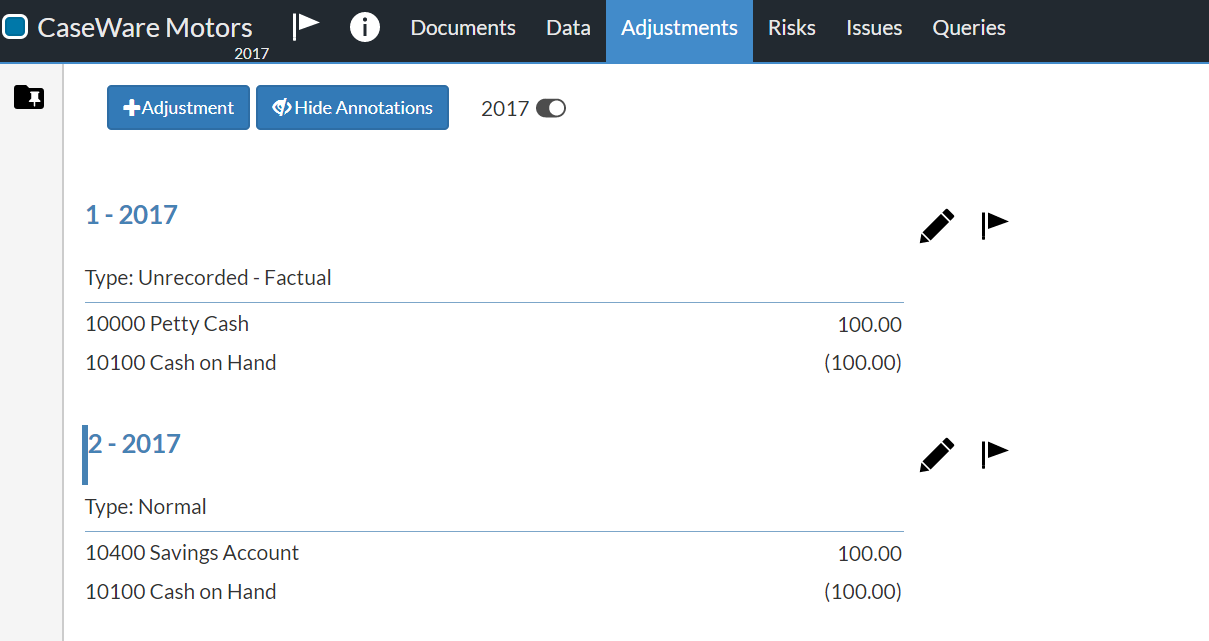
You are directed to the Adjustments page, where you can view the details of the selected adjusting entry.
Note: The selected adjusting entry is marked with a blue vertical bar on the left.
Save a view
If you've customized a view to display a specific set of data that you wish to revisit, you can save the view.
To save a view:
-
On the Data page, select the Save views icon (
 ).
). -
A list of previously saved views displays. Select Save current view.
-
Enter a name for the new view and select Save.
You can now select and manage your saved view from the list under the Save views icon ().