Analysis graphs in financial statements

Content in this topic requires Caseware ReviewComp.
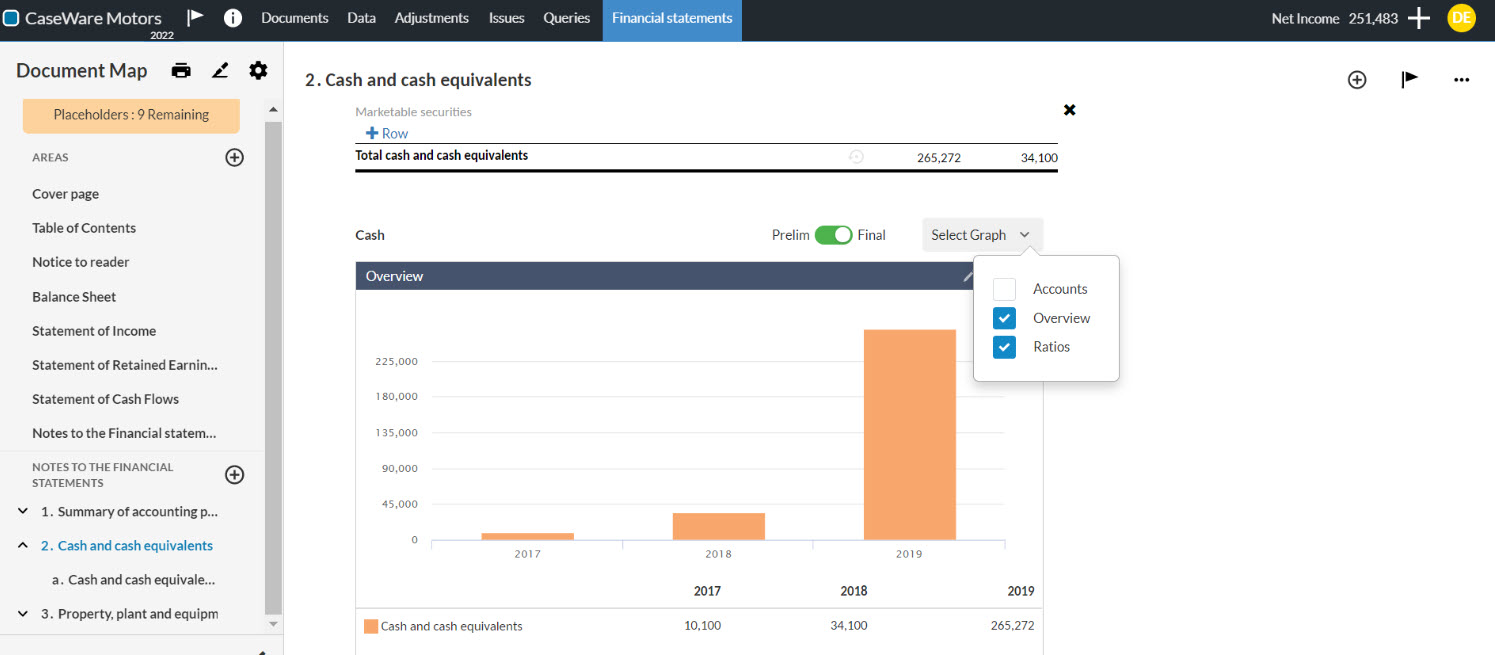
A visual presentation of your client's account information is available in certain note disclosures in the financial statements to help you perform high-level analyses and identify areas of the trial balance that you need to investigate.

By default, the analysis graphs are excluded from the notes to the financial statements. To include these graphs in your notes, select Add section, then Analysis from the Excluded Content section.
You can also include the Financial Statements Analysis Graphs section in the financial statements to populate a visual representation of your client's data in a designated section.
To include the Financial Statements Analysis Graphs section in the financial statements, respond Yes to the Would like to include analysis graphs as part of your financial statements question in the 6-15 Financial statements optimiser.

As you review the information, you can:
-
In the Overall graph, choose which analyses figures to view using the Select Graph drop-down.
-
Use the Preliminary/Final switch (
 ) to view either the preliminary or final data in the figures.
 -
Display the figure in a full size across the section select using the Full size icon (
 ).
). -
Select the Edit icon (
 ) in the figure's title bar, then select the Add icon (
 ) to add an item to the figure or select Remove (
 ) to remove an item from the figure.
Note: The Add icon (
 ) is only available if one or more of the predefined items in the graph are not included by default. Otherwise, the Remove icon (
 ) is on only available.
 -
Add comments or notes at the Edit documentation comments… text field.
-
Select the Reset to default icon (
 ) to reset the figure to its original state.
Tipp: You can also close a figure (![]() ) to have it removed from the display.
) to have it removed from the display.
