Analytical review
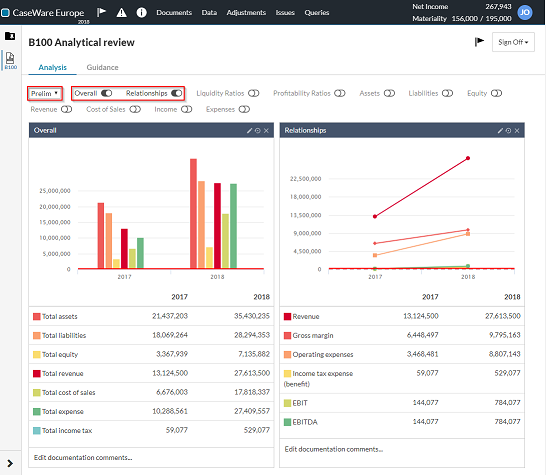
Use the B100 Analytical review to identify relationships (for possible use in substantive analytical procedures), risks, inconsistencies as well unusual transactions, events, amounts, ratios or trends that will likely require an audit response.
The analysis charts in this document are linked to data throughout the engagement to help auditors visually compare data and discover trends and patterns using predefined data analytics.
Use the drop-down to select Preliminary or Final results. Use the filter switches to display the desired analyses figures. This example shows Overall and Relationships.
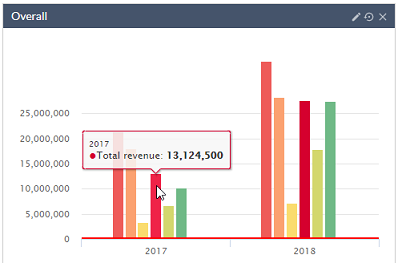
The figures are interactive. Place your cursor over a specific item in the figure to see more information.
Select an item below the graph to display more details for it. For example, if Total equity is selected in the above graph, the following displays.
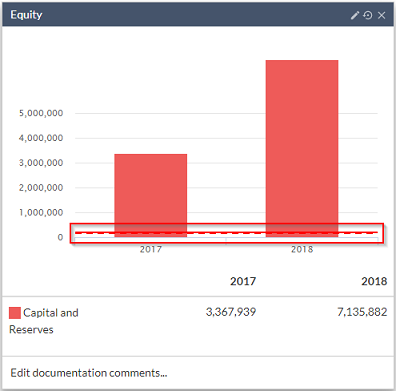
Materiality is shown as the dashed line in the graph. It also appears at the top of the page.

Select Edit documentation comments to add remarks to a figure.
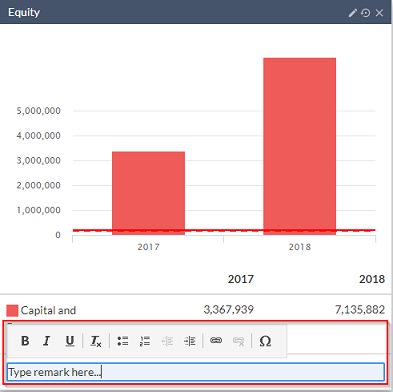
Use the buttons at the top of a widget (![]() ) to Edit, Reset to default or Hide the figure.
) to Edit, Reset to default or Hide the figure.