Risks and Controls
This Sherlock International visualization provides details related to Risks and Controls, including:
Each tab includes controls to display data based on the client name and year end.
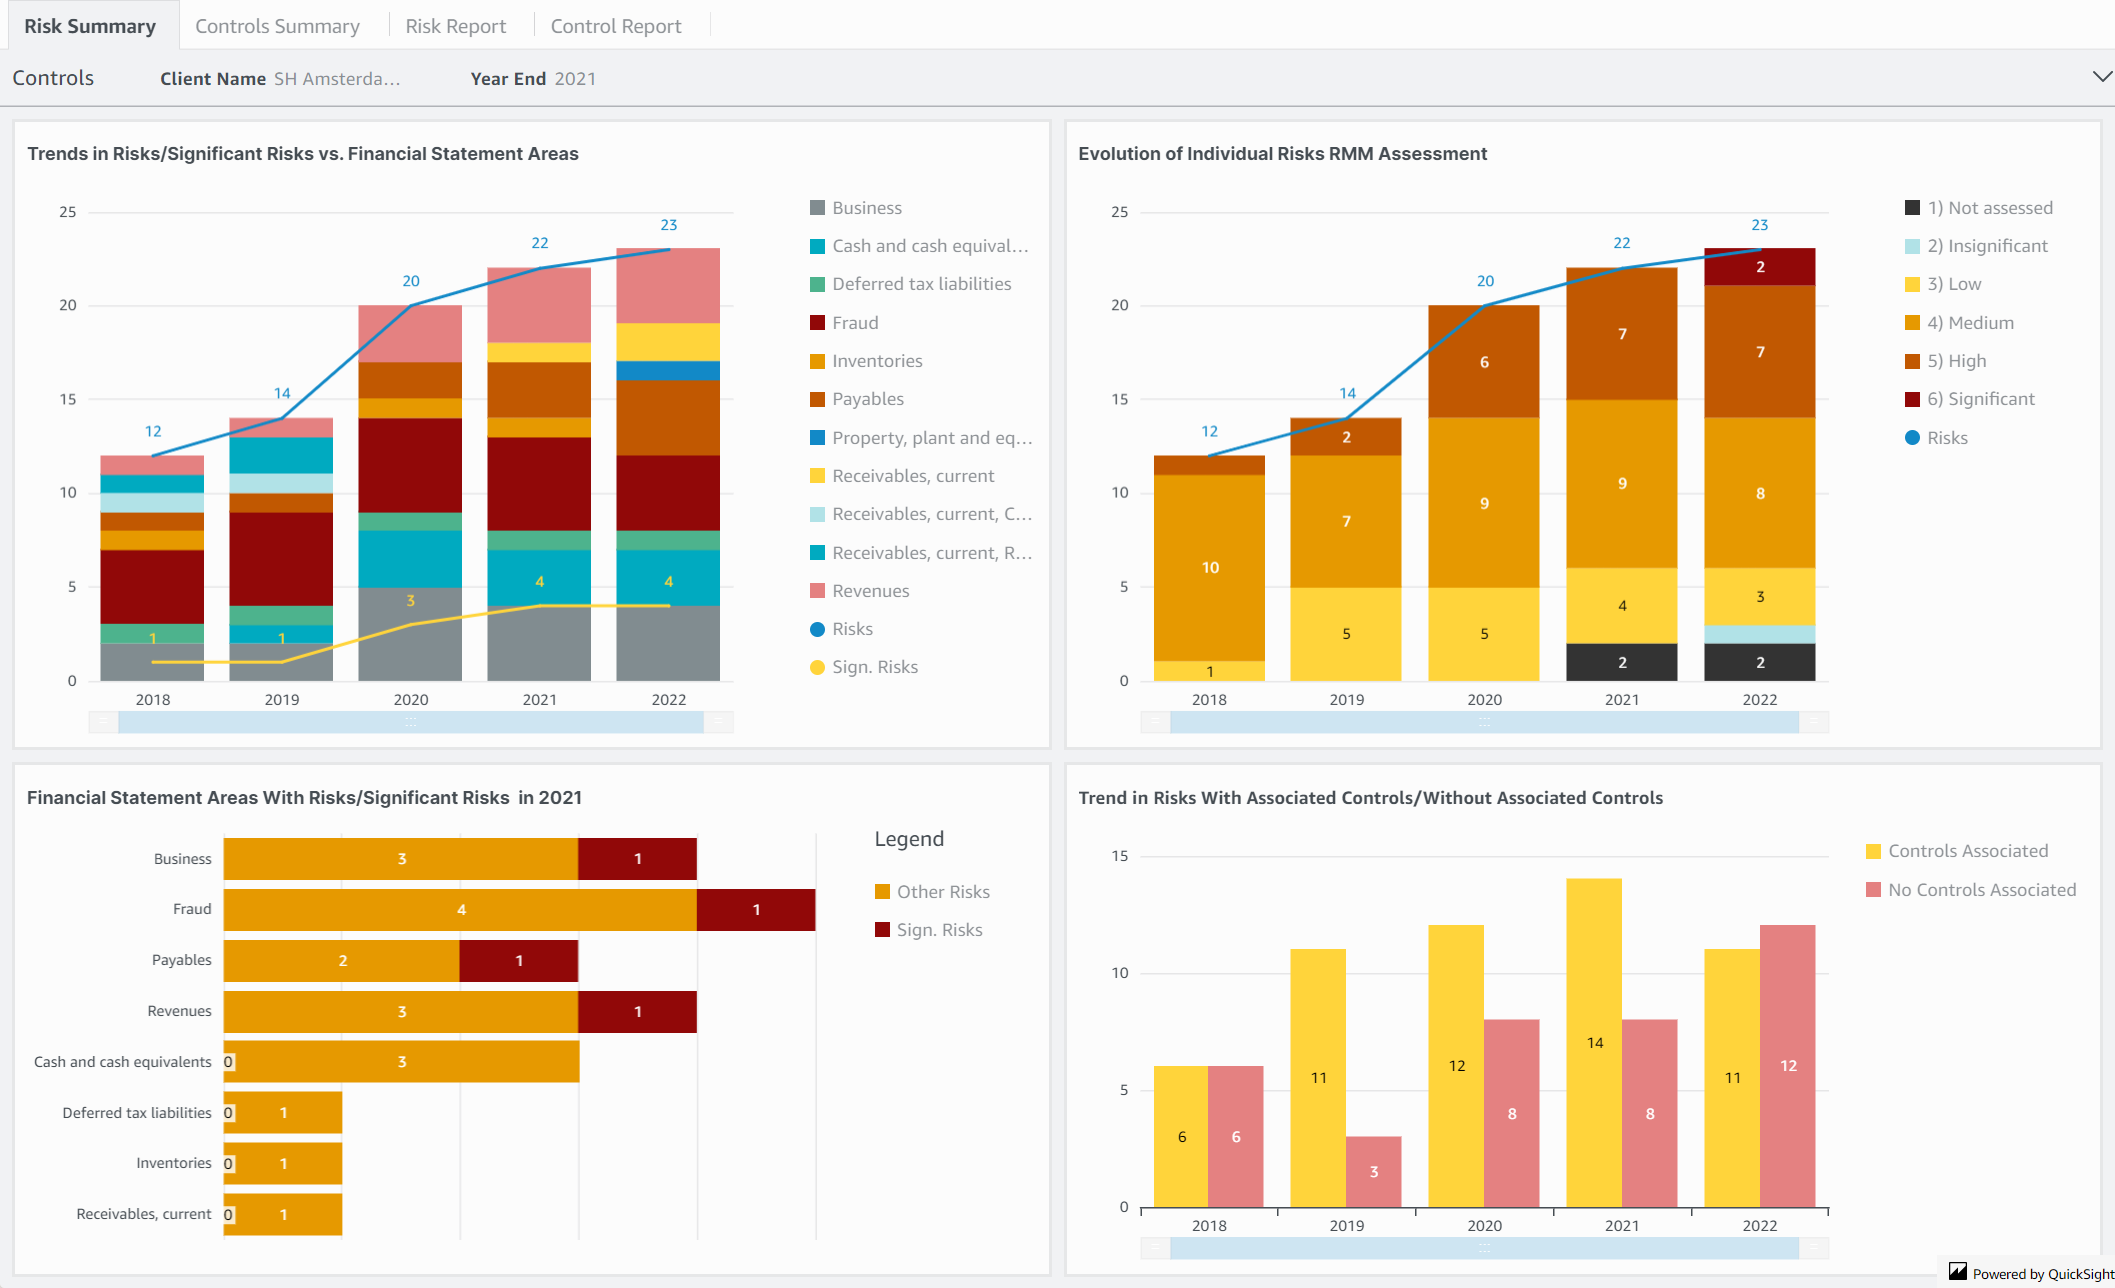
Risk Summary
| Widget | Description |
|---|---|
| Trends in Risks/Significant Risks vs. Financial Statement Areas | Displays the number of risks and significant risks, year over year, for each Financial Statement Area. |
| Evolution of Individual Risks RMM Assessment | Displays the breakdown of the total number of risks based on the individual assessment of Risk of Material Misstatement, year over year. |
| Financial Statement Areas with Risks/Significant Risks | Displays the number of risks and significant risks, for the selected year, for each Financial Statement Area. |
| Trend in Risks with Associated Controls/Without Associated Controls | Displays the number of risks with and without associated controls, year over year. |
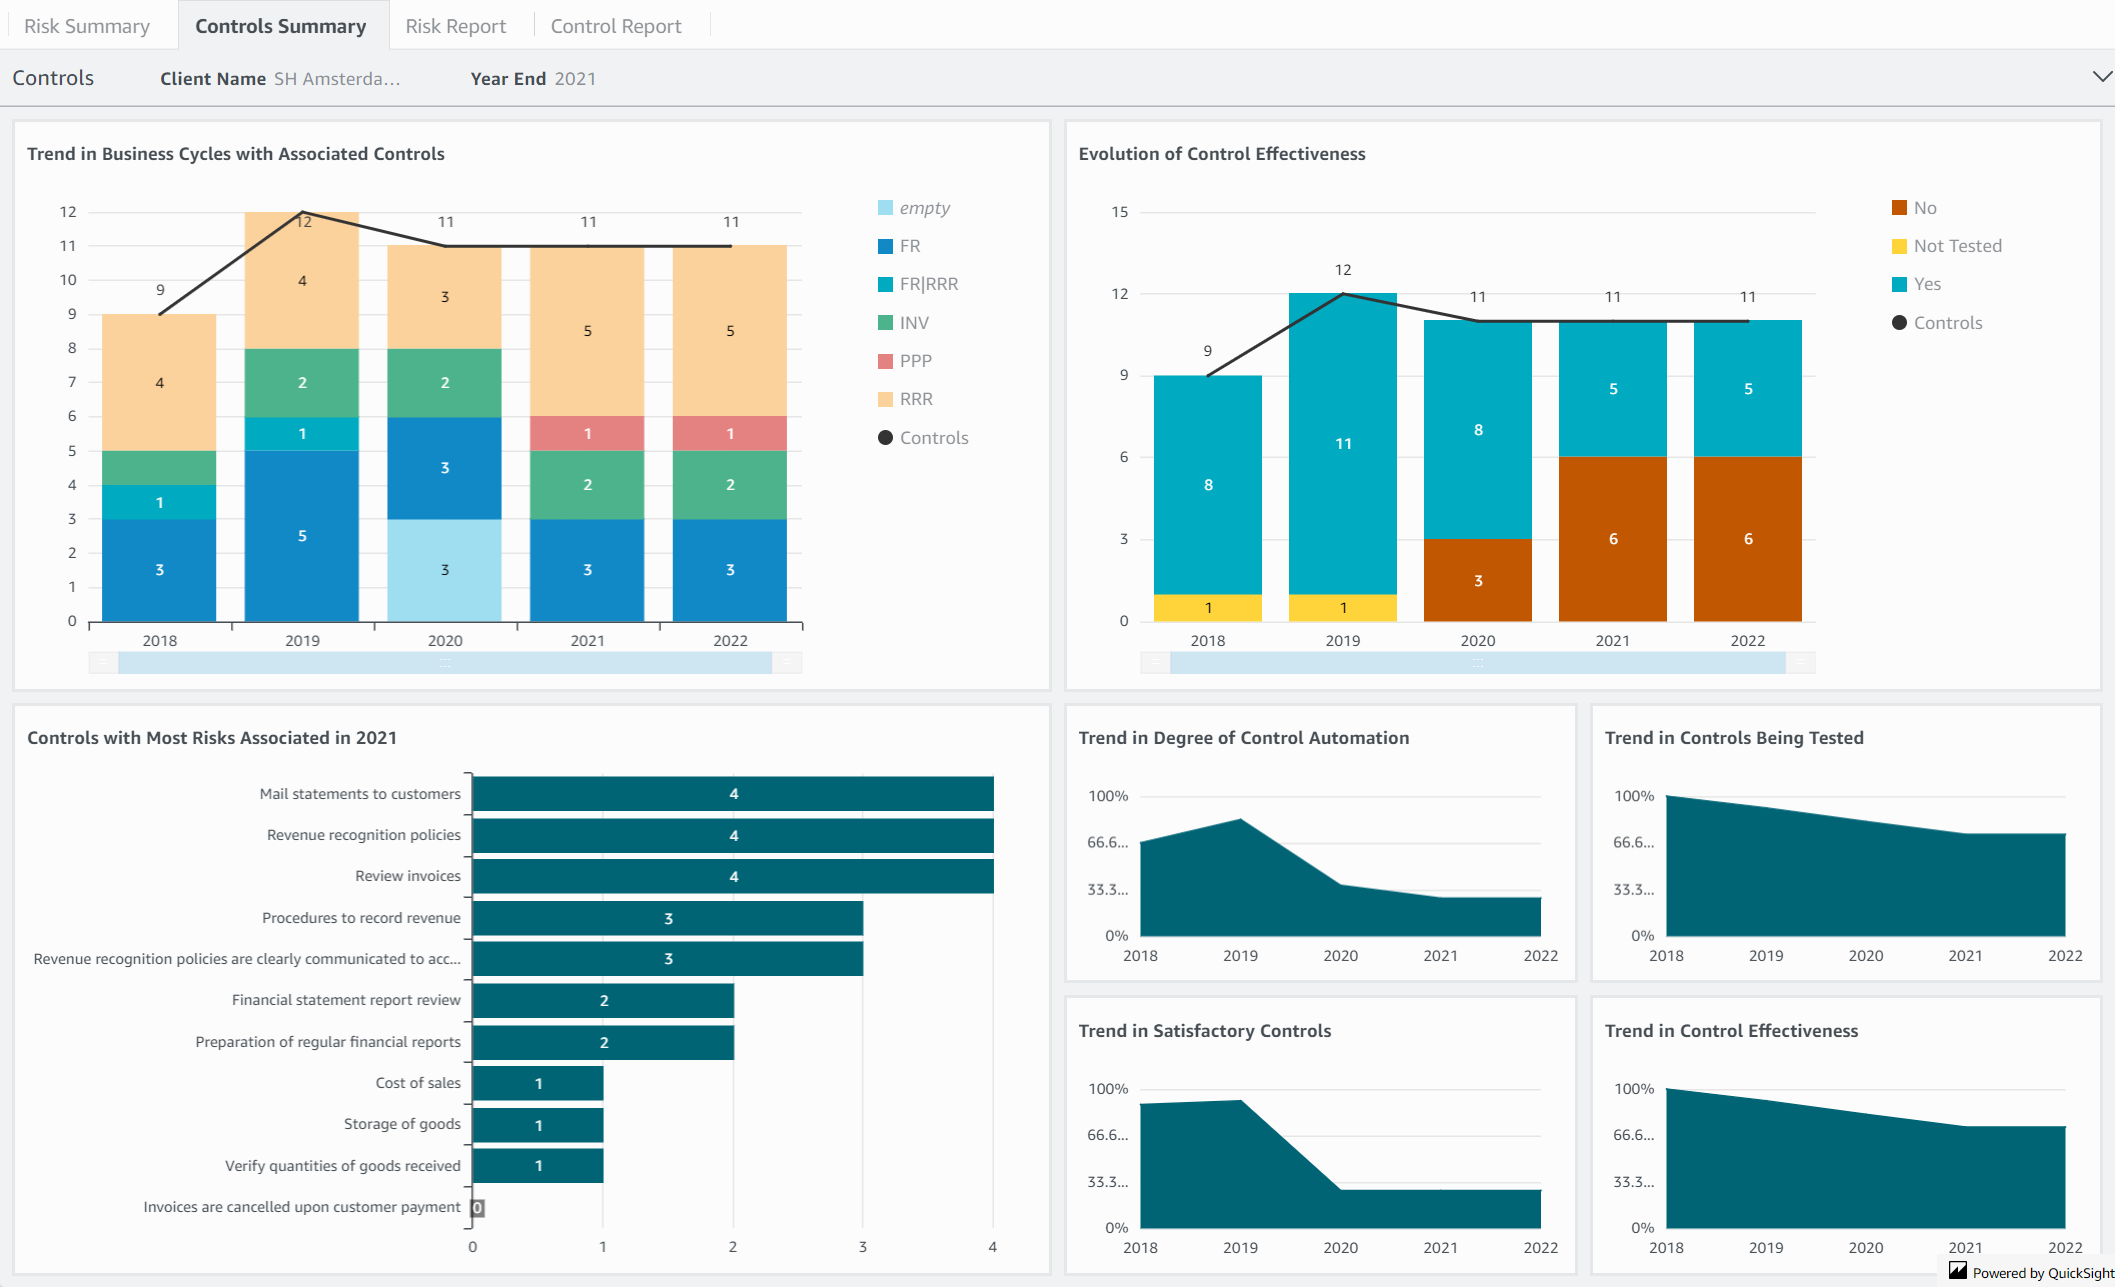
Controls Summary
| Widget | Description |
|---|---|
| Trend in Business Cycles with Associated Controls | Displays the number of controls, year over year, for each Business Cycle. |
| Evolution of Control Effectiveness | Displays a breakdown of the total number of controls based on the individual assessment of control effectiveness, as well as if controls have not been tested, year over year. |
| Controls with Most Risks Associated | Displays the number of risks associated with each control for the selected year. |
| Trend in Degree of Control Automation | Displays the percentage of automated controls out of total controls, year over year. |
| Trend in Controls Being Tested | Displays the percentage of tested controls out of total controls, year over year. |
| Trend in Satisfactory Controls | Displays the percentage of satisfactory evaluation controls out of total controls, year over year. |
| Trend in Control Effectiveness | Displays the percentage of effective controls out of total controls, year over year. |
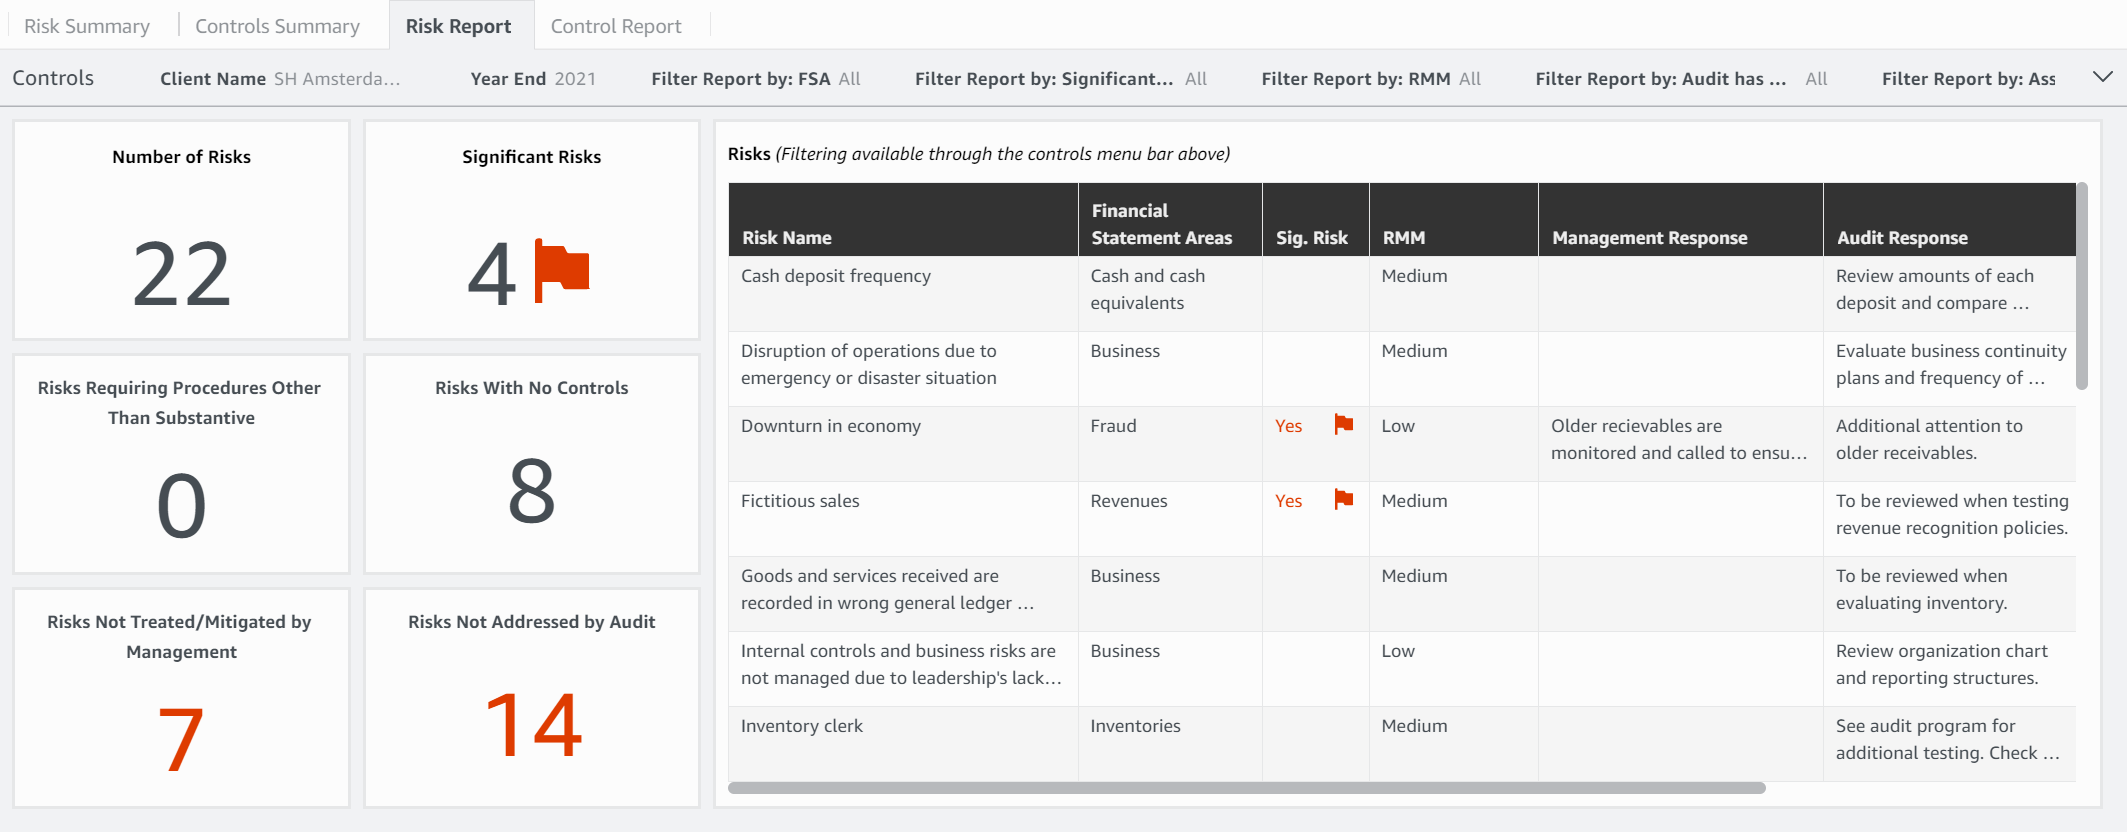
Risk Report
| Widget | Description |
|---|---|
| Risk cards | Displays for the selected year:
|
| Risks | Displays details of the risks and corresponding properties for the selected year. Additional filtering is available on the Controls bar. |
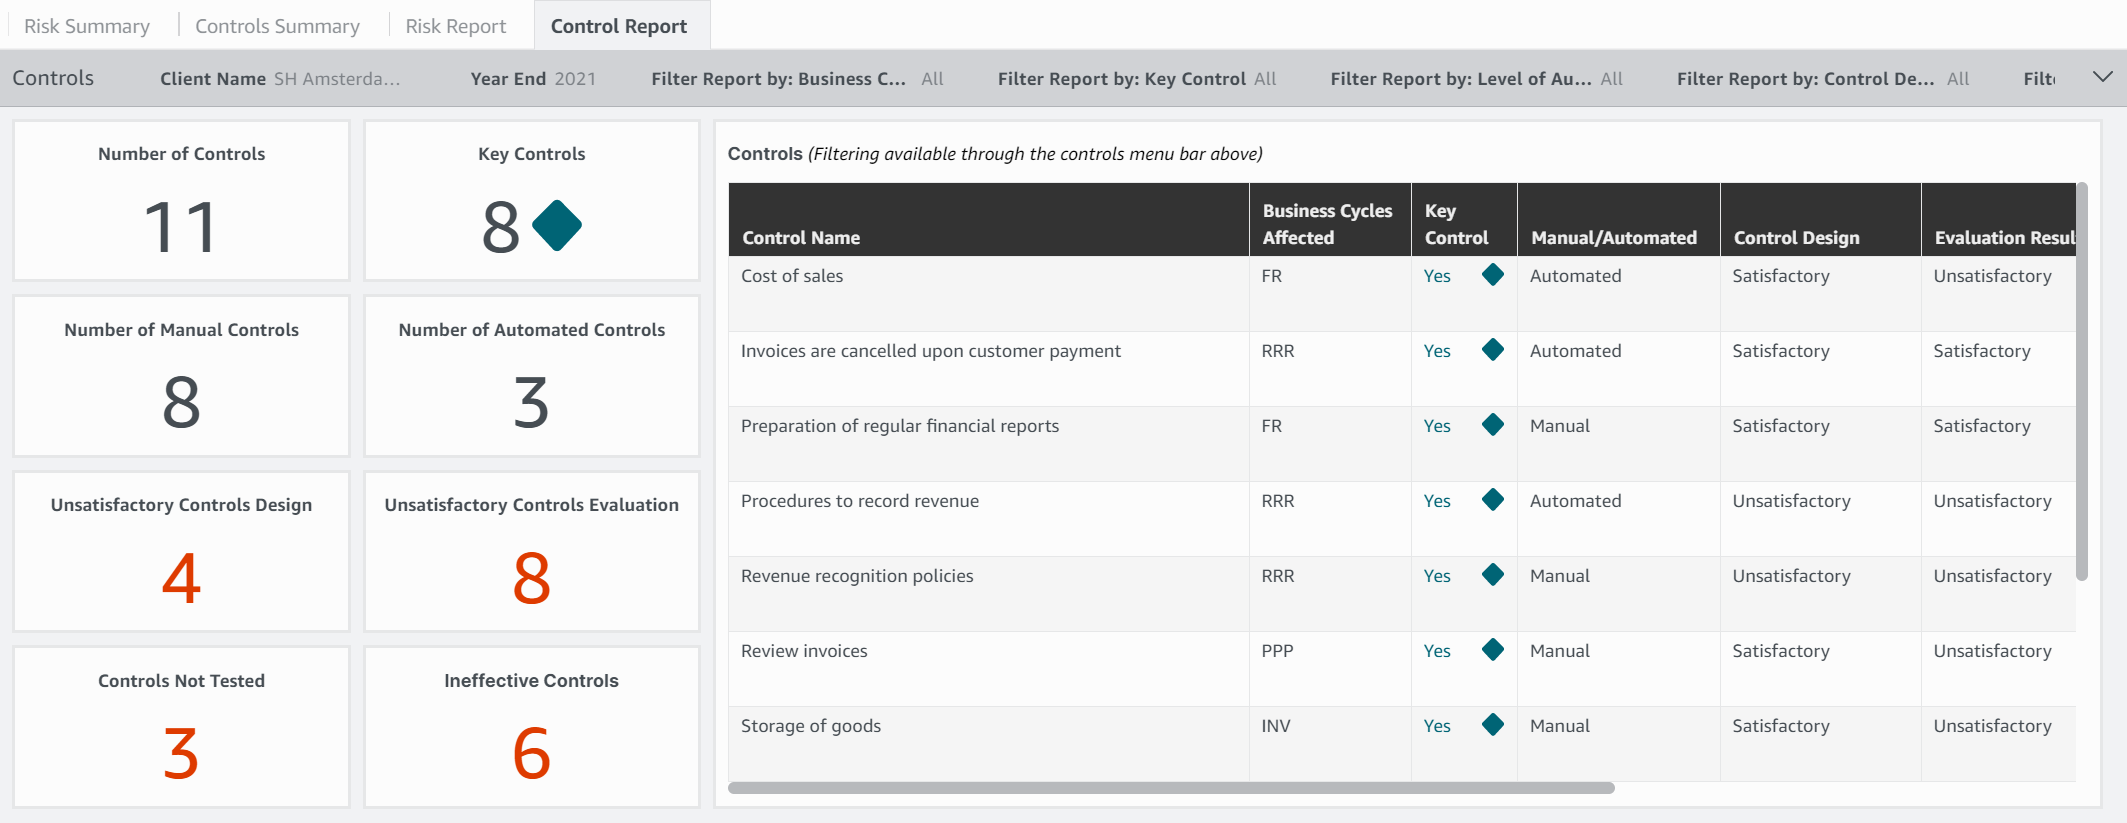
Control Report
| Widget | Description |
|---|---|
| Controls cards | Displays for the selected year:
|
| Controls | Displays details of the controls and corresponding properties for the selected year. Additional filtering is available on the Controls bar. |